LG Inform Home Page and Search Guide
1. Public Access Home Page
The LG Inform Home page - The home page is divided into three sections
- Welcome - A welcome message provides a brief overview of the website – this can be removed by clicking Hide.
- It may appear again if the LG Inform team have an important communication to advise
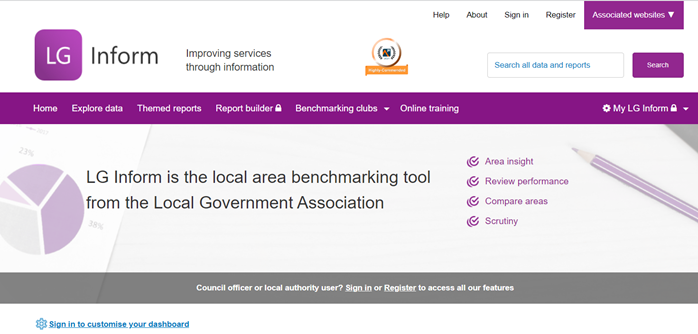
- Navigation – Note the ‘padlocks’ against some headings on the navigation bar and the ‘Sign-in to customise your dashboard’ link. Local authority users can register with us to access this functionality. For example, they can create their own reports or dashboard for personal use or sharing with others.
- Dashboard - A mini dashboard showing six metrics focusing on key/topical data. If your location is enabled, this will automatically pick up an authority near to you, if your location is disabled the default option is England.
- You can also search by area or postcode to bring up the authority of your choice.
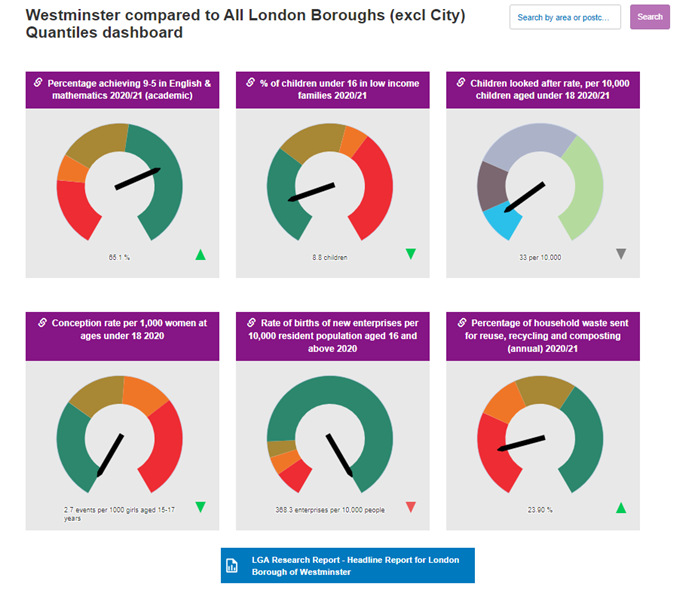
- Standard Report - By clicking on any of the metric titles, it is possible to open up a specific report for each metric.
- Headline Report - A Headline Report for the area is also available by selecting Headline Report underneath the dashboard. This report provides a selection of comparable value for money and performance data for services metrics that can be compared with other local authorities/regions across England.

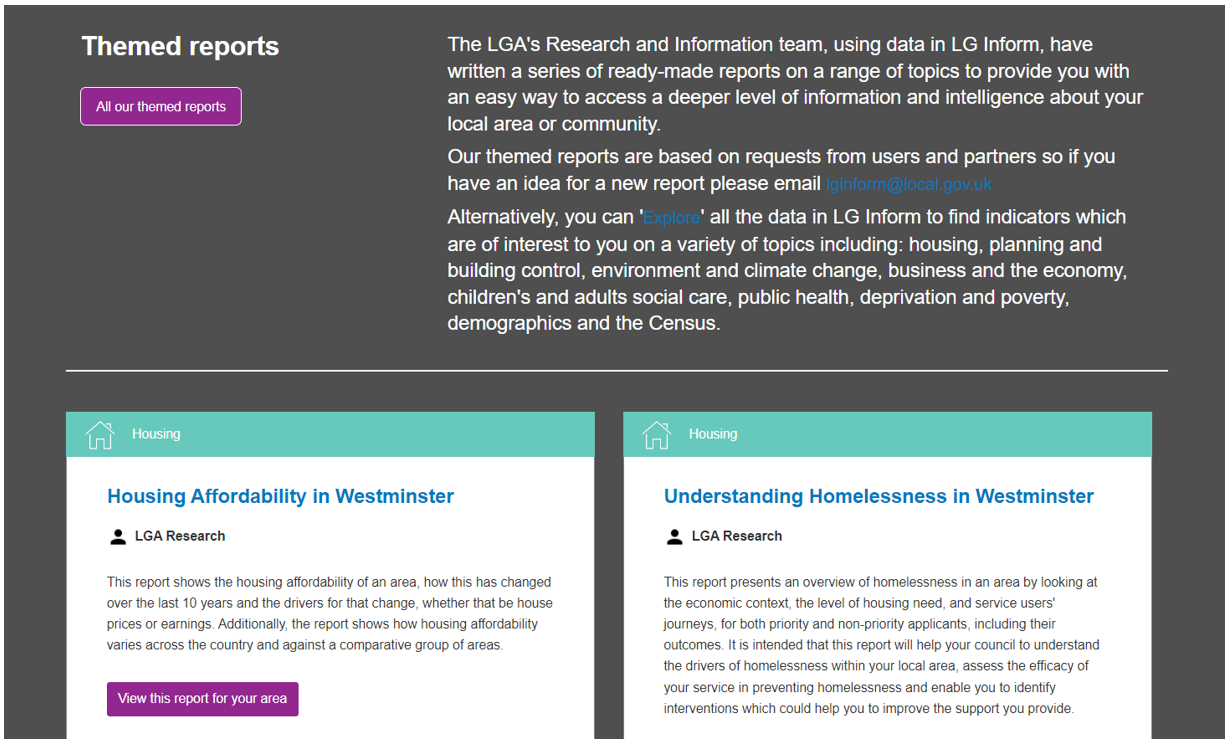
- LGA Themed Reports Library – the ‘All our themed reports’ button takes you to over 50 pre-built reports created by the LGA’s Research and Information team.
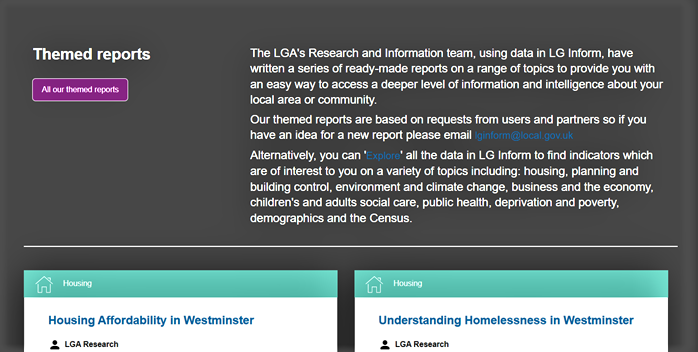
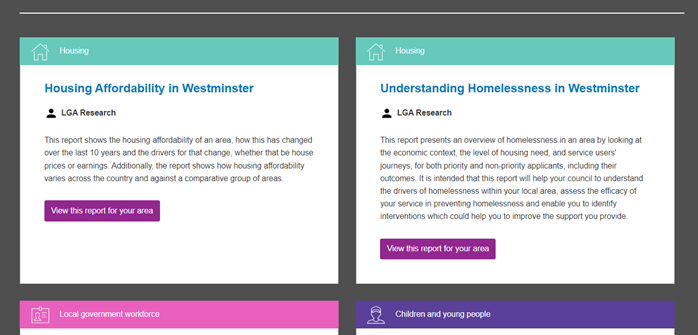
- Selected Reports - The final area of the Home page presents examples from the range of themed reports created by the LGA Research and Information team. You can select a report by clicking on the title.
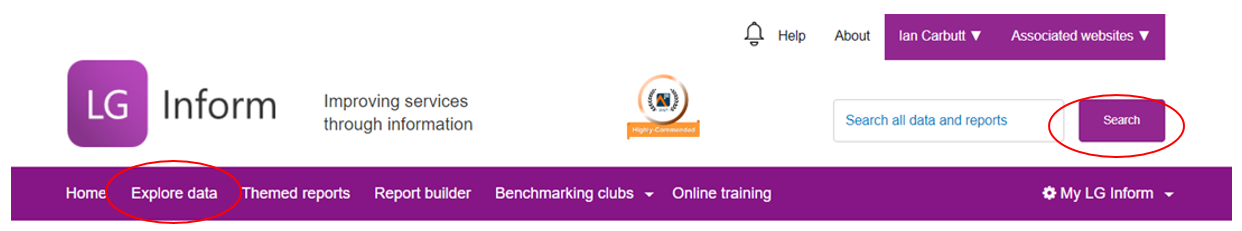
- Navigation - When looking at the website via the public access home page, a number of options are available on the menu dropdowns at the top of the page:
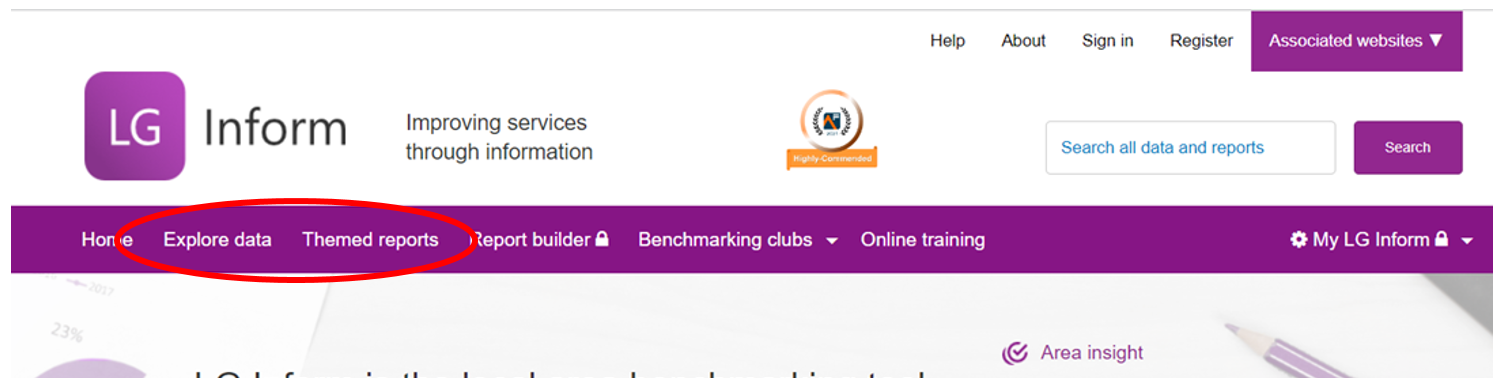
- Explore data and Themed reports – the Explore data tab enables users to go to the LG Inform Explorer and Search engine. The ‘Themed reports’ tab enables users to go to the LGA Themed Reports area.
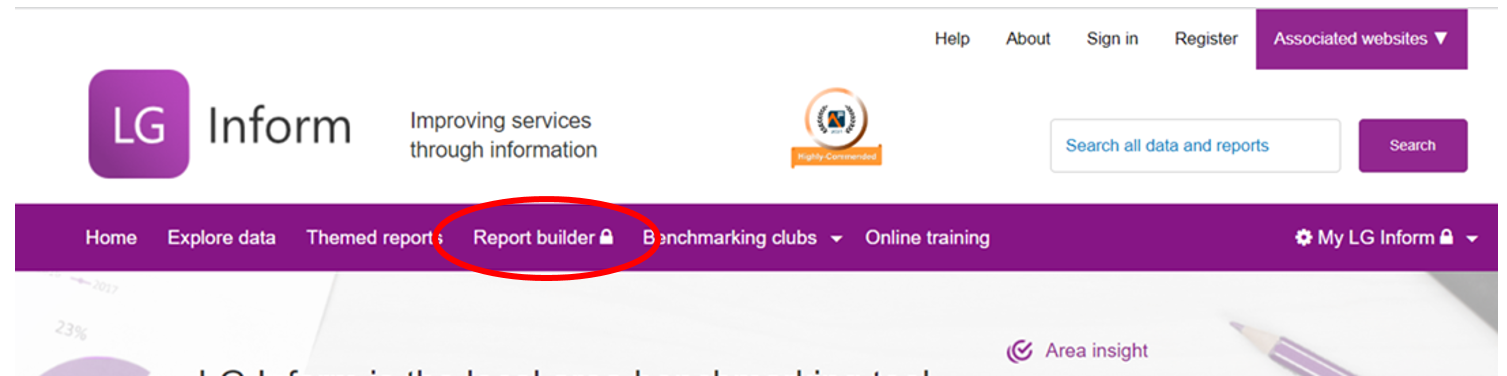
- Report Builder – this tab enables registered users to visit the ‘Report builder’ to create their own reports from the LG Inform database of metrics.
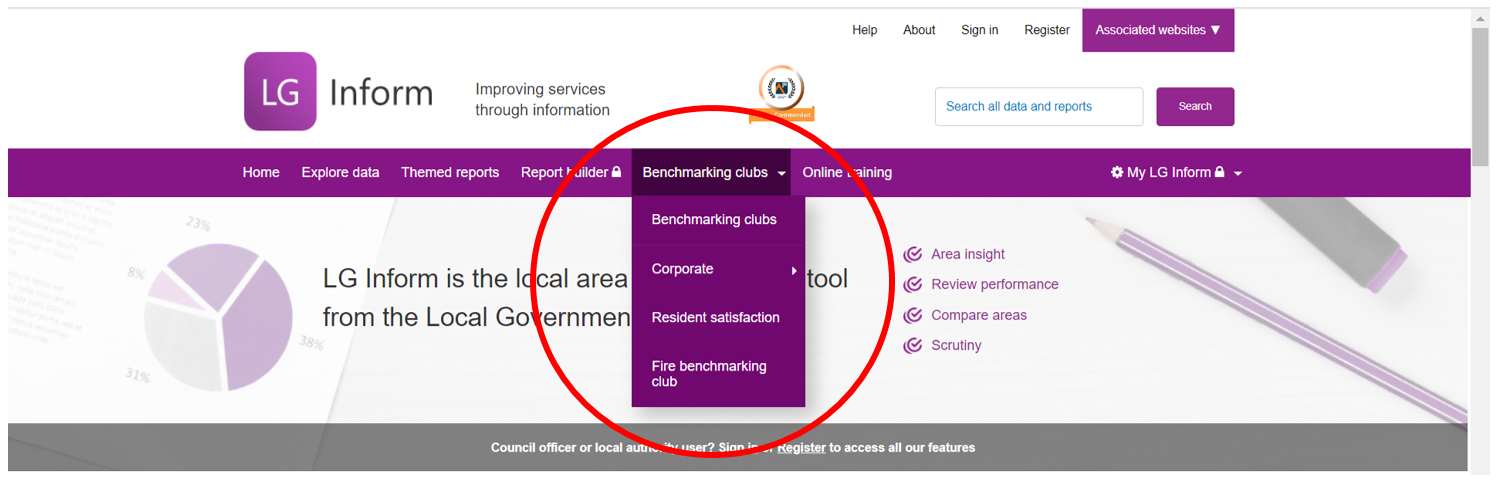
- Benchmarking clubs – this highlights the LG Inform Benchmarking clubs run by the LGA Research team which are available to local authorities.
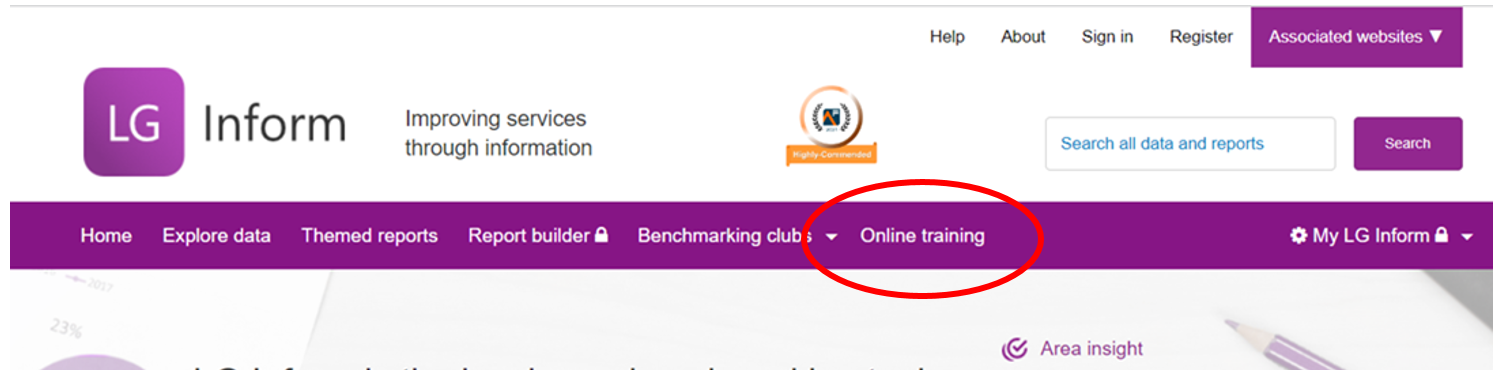
- Online training – this tab shows the webinar programme available to any user covering both LG Inform and LG Inform Plus.
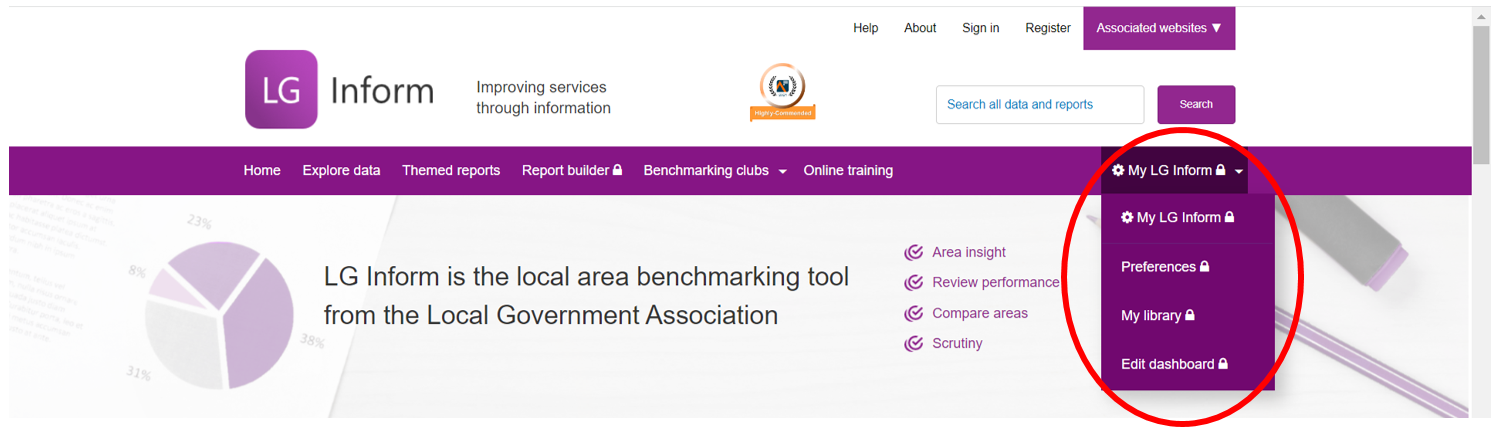
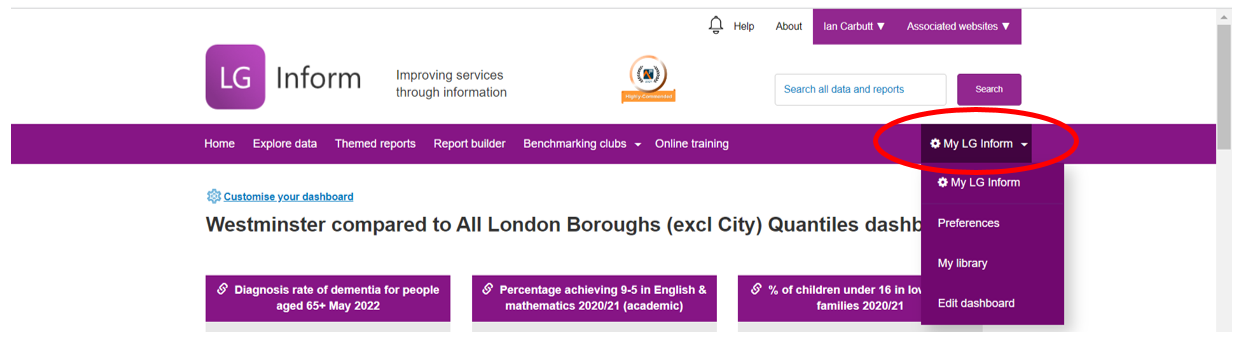
- My LG Inform – This tab shows additional functionality available to registered users. For example: Edit dashboard and Preferences.
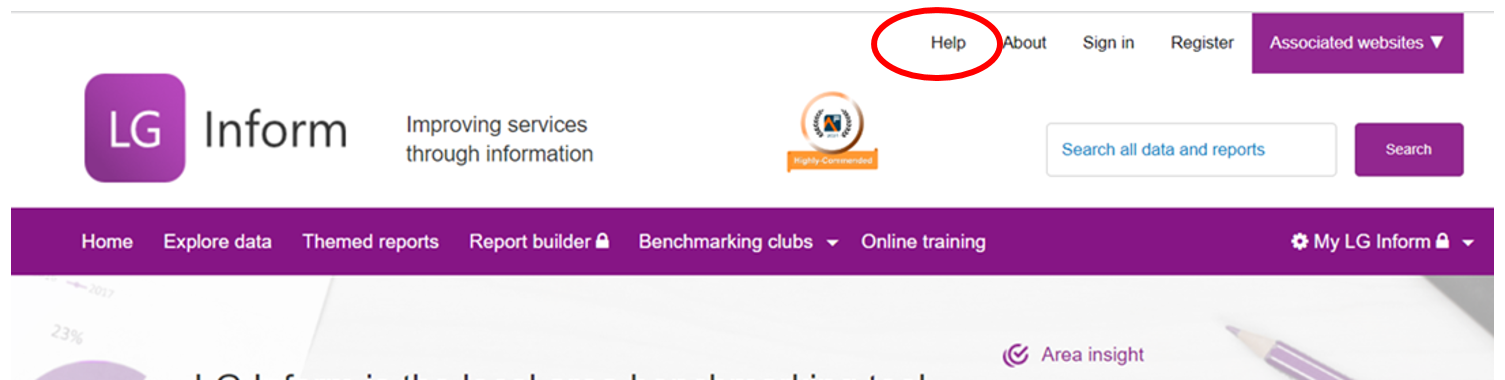
- Help – this link takes you to useful information about using the site and background information.
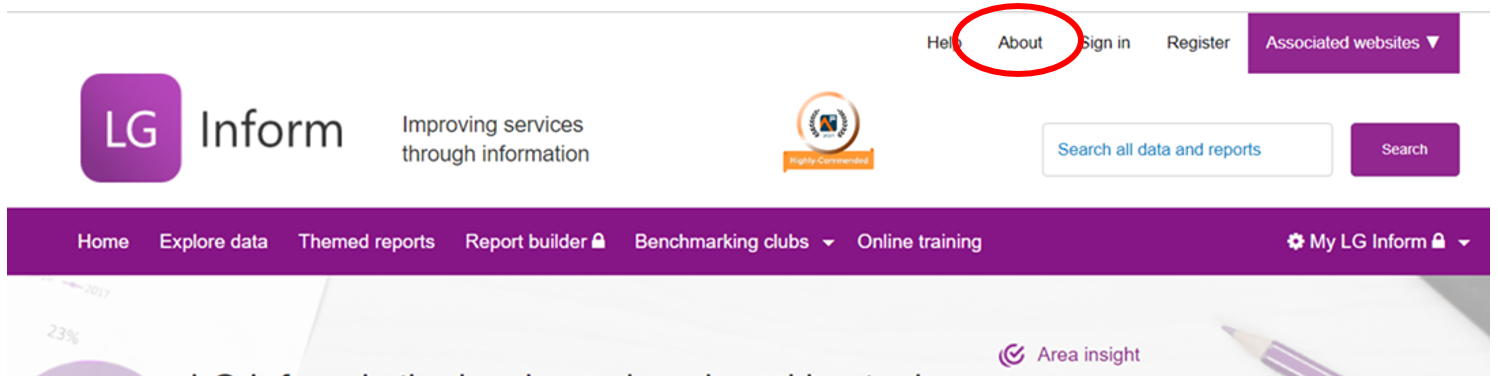
- About: Provides an explanation and purpose of LG Inform and takes you to the following useful areas:
- Contact: Provides an option to register with LG inform if you have a gov.uk email address, and provides contact details for the support team
- FAQ: Provides background information regarding LG Inform
- Help: Provides links to areas of the website relevant depending on the help required
- User Guides: Guides on how to use LG Inform, covering common tasks and user requirements
- Resident Satisfaction: Guidance for councils carrying out general population surveys and would like to include questions on resident satisfaction, crime and cohesion, and benchmark these results against other councils in LG Inform
- Benchmarking local data in LG Inform: A voluntary process aimed at collecting local data directly from councils for benchmarking
- Fire benchmarking club: A voluntary process aimed at collecting local data directly from fire authorities for benchmarking
- Online Training: Access to online training guides, and information on upcoming online training sessions
Back to top
2. Registered Users Home Page
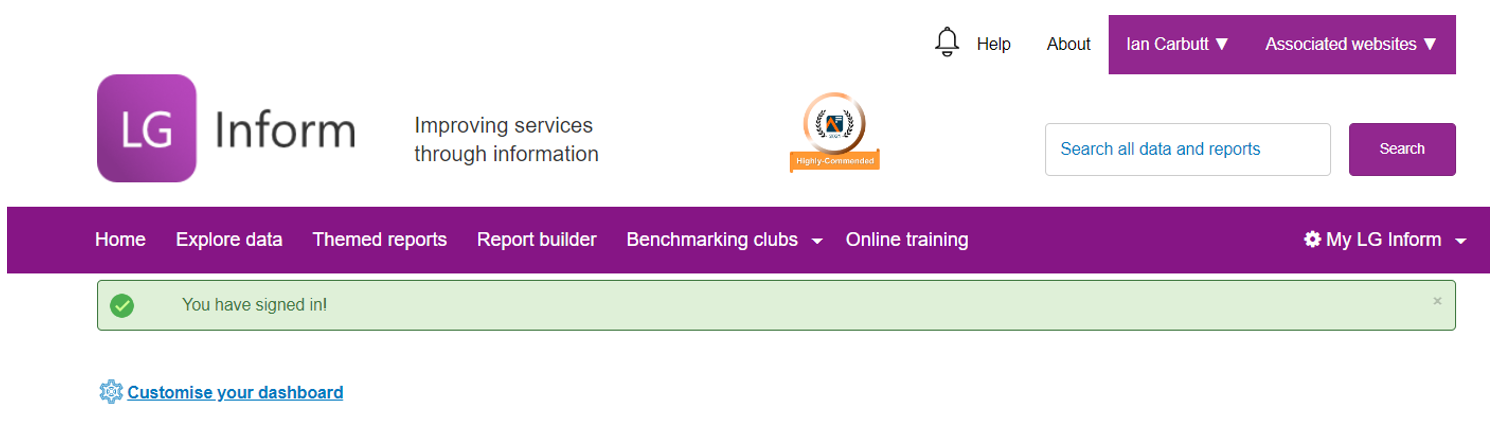
For those that have registered with LG Inform and have signed in, the options available will be slightly different on the home page. Note the ‘padlocks’ will disappear and you will see your name.
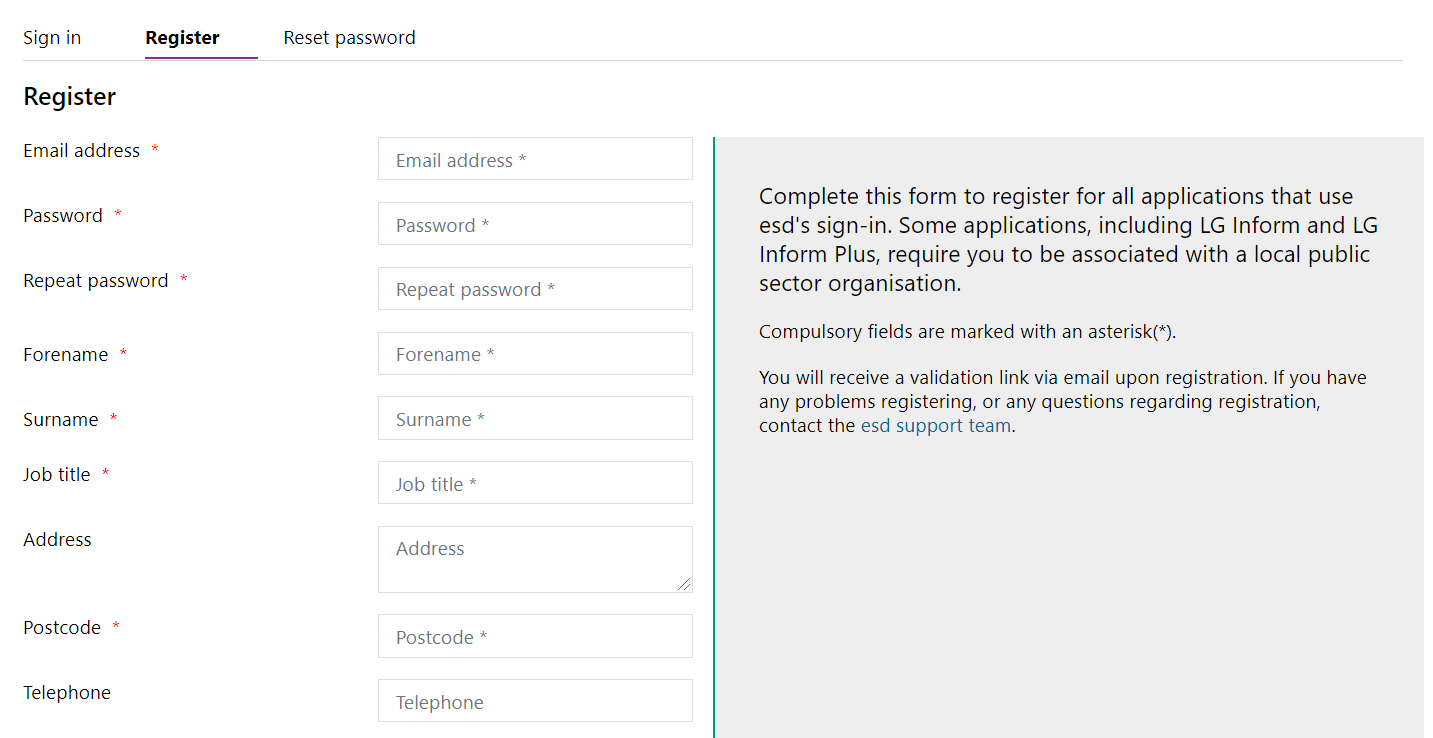
- To register for an account with LG Inform, click Register. You will be taken to the screen below and should fill in your details accordingly. You will also be asked to confirm you agree to the terms and conditions.
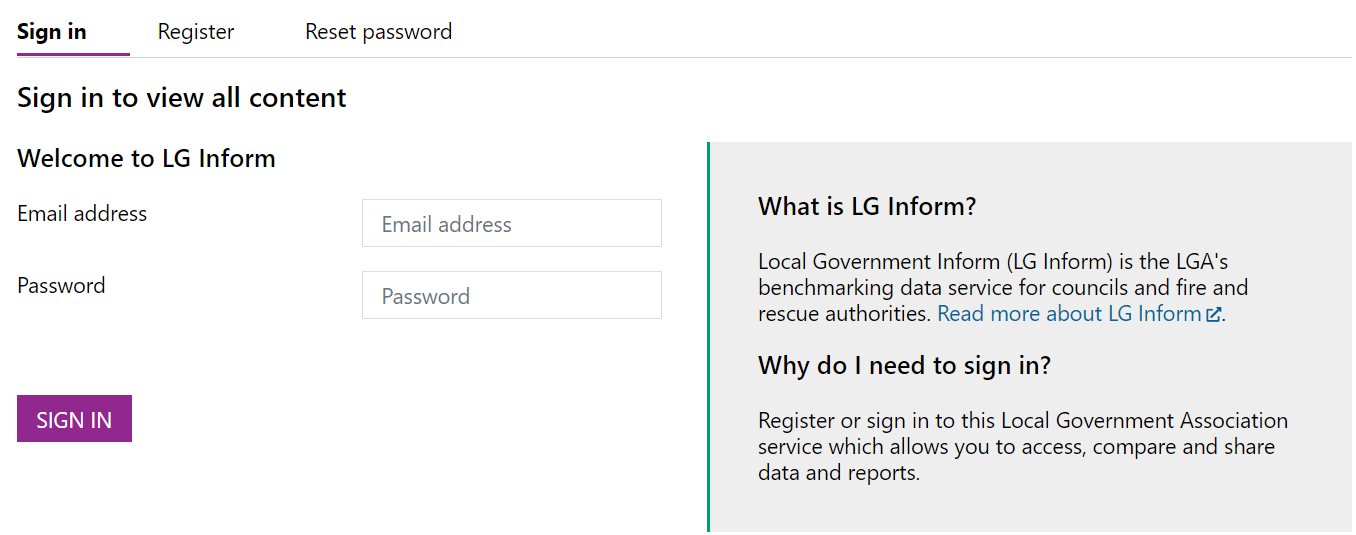
- If you have already registered, click Sign In. You will be taken to the screen below, and should login with the details you used when registering.
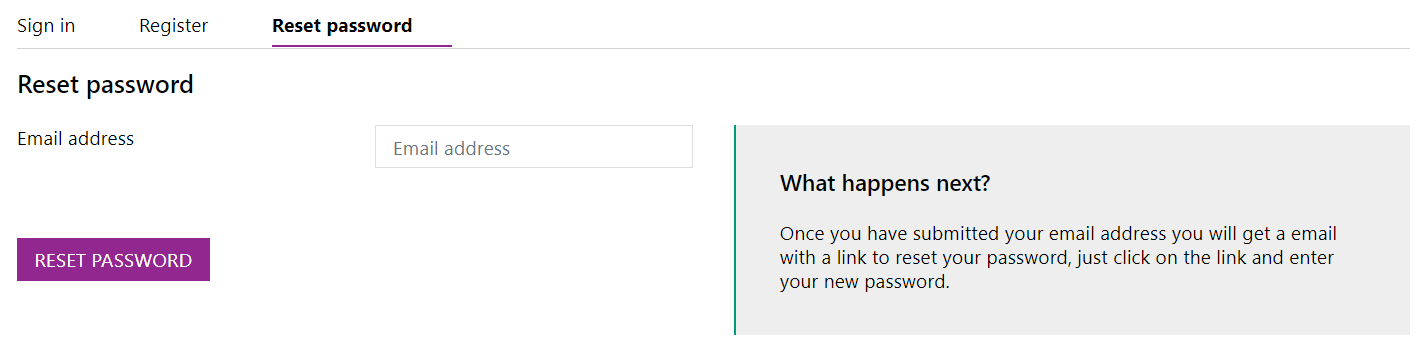
- If you have forgotten your password, select the link on the left; Reset Password. You will be asked to provide the email address you registered with.
- Once you have signed in, your home page will differ slightly. The dashboard will be adjusted to the area relevant for you from your registration, and the Search by area or postcode box has been removed as a result.
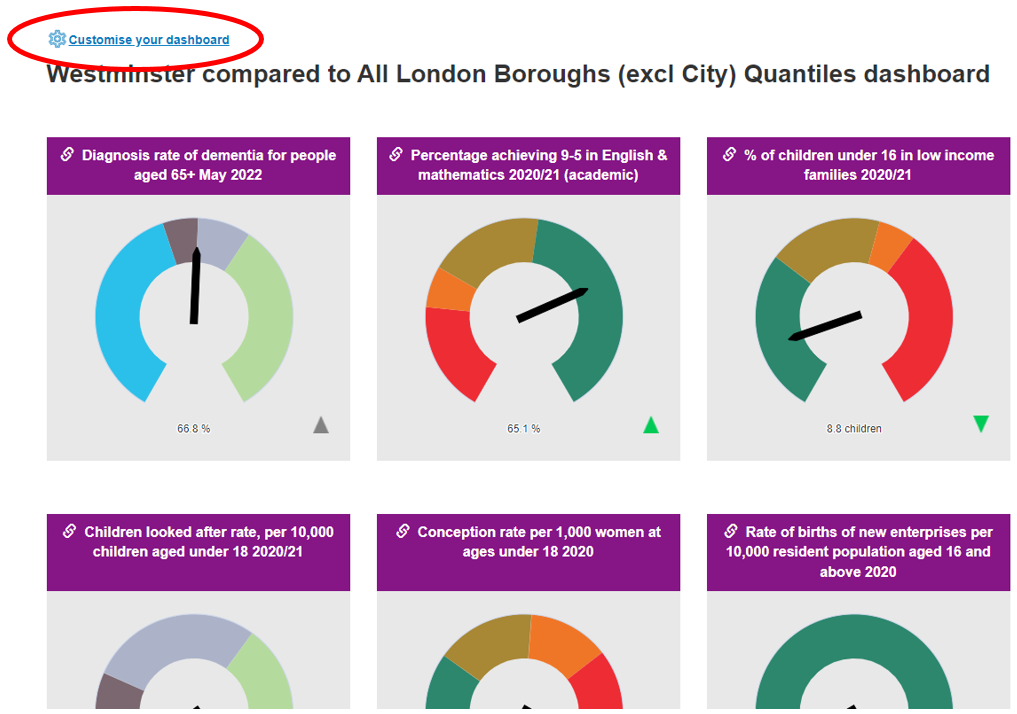
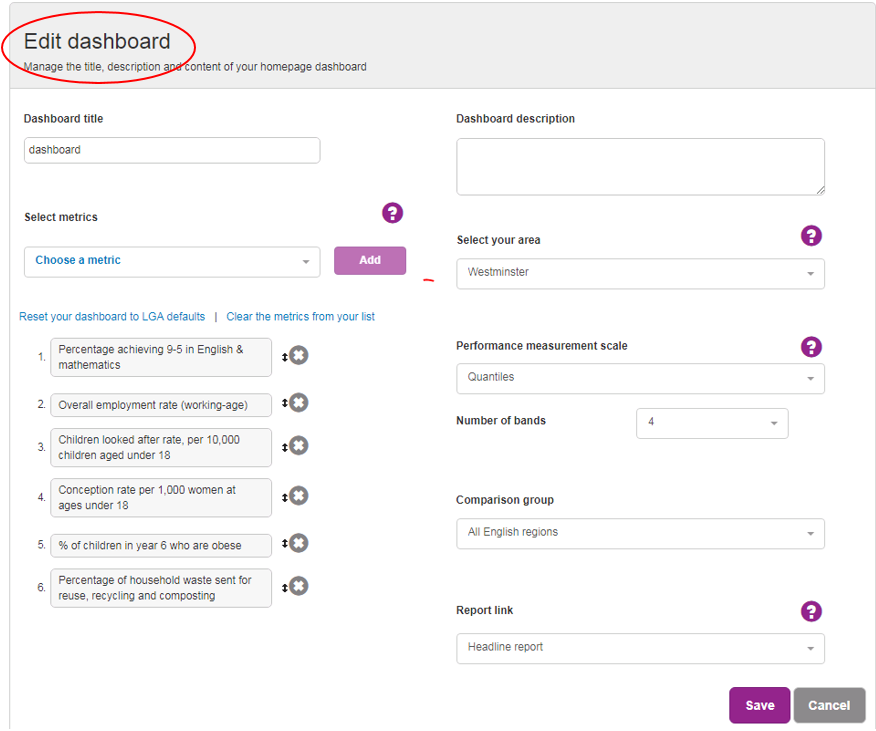
- The metrics on the dashboard are set by default again, but now can be customised through My LG Inform or by clicking on Customise your dashboard.
- You can:
- Select up to six different metrics to show and decide the order by which they appear
- Change the area the metrics cover (this will by default be set as the authority you have registered as)
- Choose the calculation method to control how the RAG status is applied
- Set the comparison group for the metrics
- Link a report – this can be one written by the LGA or your own (more information on how to build a report is in our guide: ‘Report Builder – Building a Report’)
- Any changes saved will show on the home page the next time you visit it
- You can:
- Beneath the dashboard you can visit the LGA Themed reports library and view a number of recent LGA Reports. By clicking on the blue titles they will open for viewing.
- Two extra options are available from the dropdown menu at the top of the page for users that have signed in:
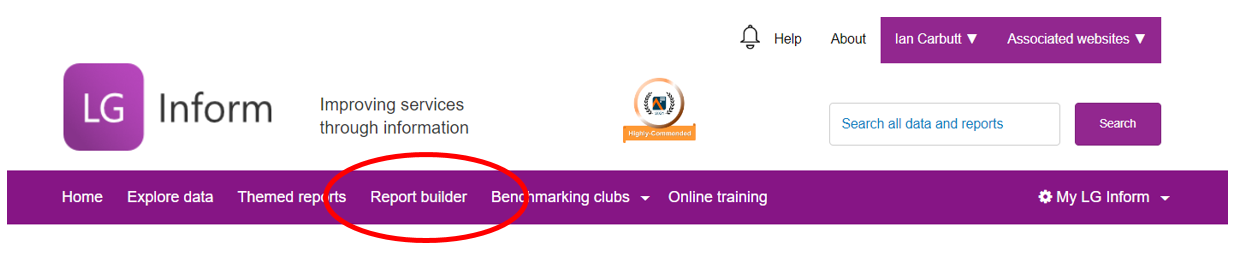
- Report Builder - will allow you to build your own reports using various metrics within the system. More information on how to build reports can be found in our training guide ‘Report Builder – Building a Report’.
- My LG Inform - provides you with the options where you can personalise areas of LG Inform, view documents that you have created, edit your home page dashboard and edit your profile.
Back to top
3. All Users - Data and Reports: Search Function
- All users will have access to the Explorer and Search function via the Explore data tab, which is located on the toolbar across the top of the website. This function can be used to locate particular metrics or reports:
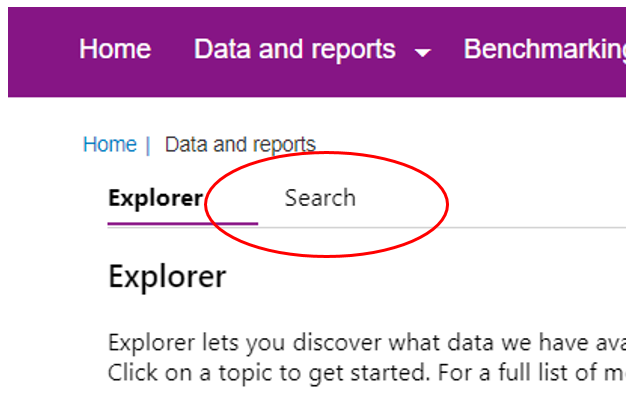
- You have the option to use the 'Explorer' or 'Search'
- Explorer - allows you to search the LG Inform Database by 'key themes' such as Housing or Community Safety.
- Search - you can use 'key words' to look for certain data and reports. Any that match with report titles, alternative report titles (e.g. NI and BVPI titles), service areas and tags.
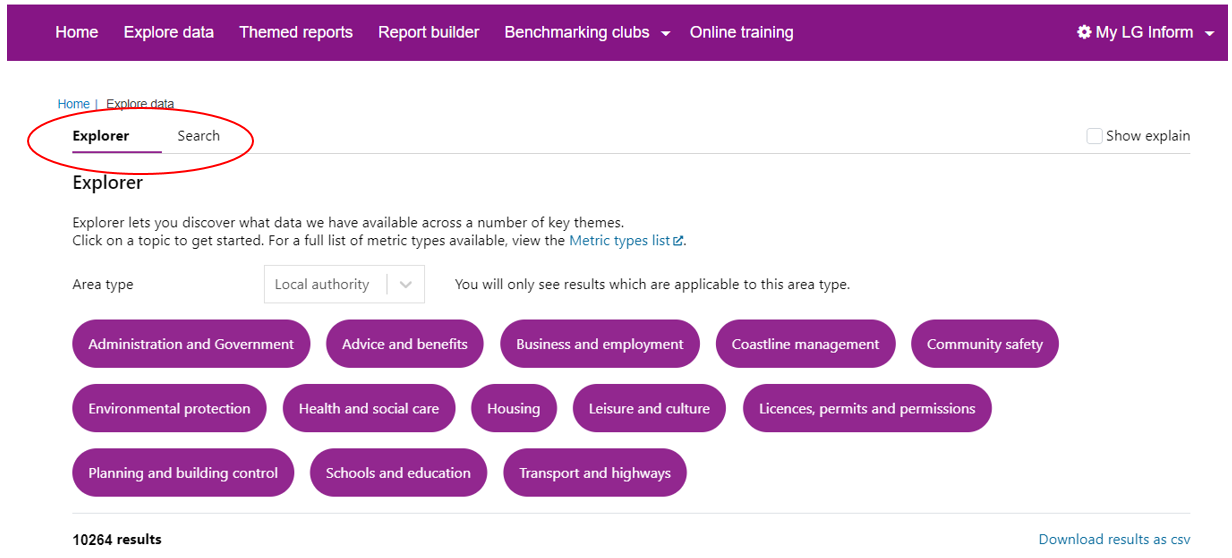
- By clicking one of the purple icons e.g. Housing: a set of results is delivered to you. See below:
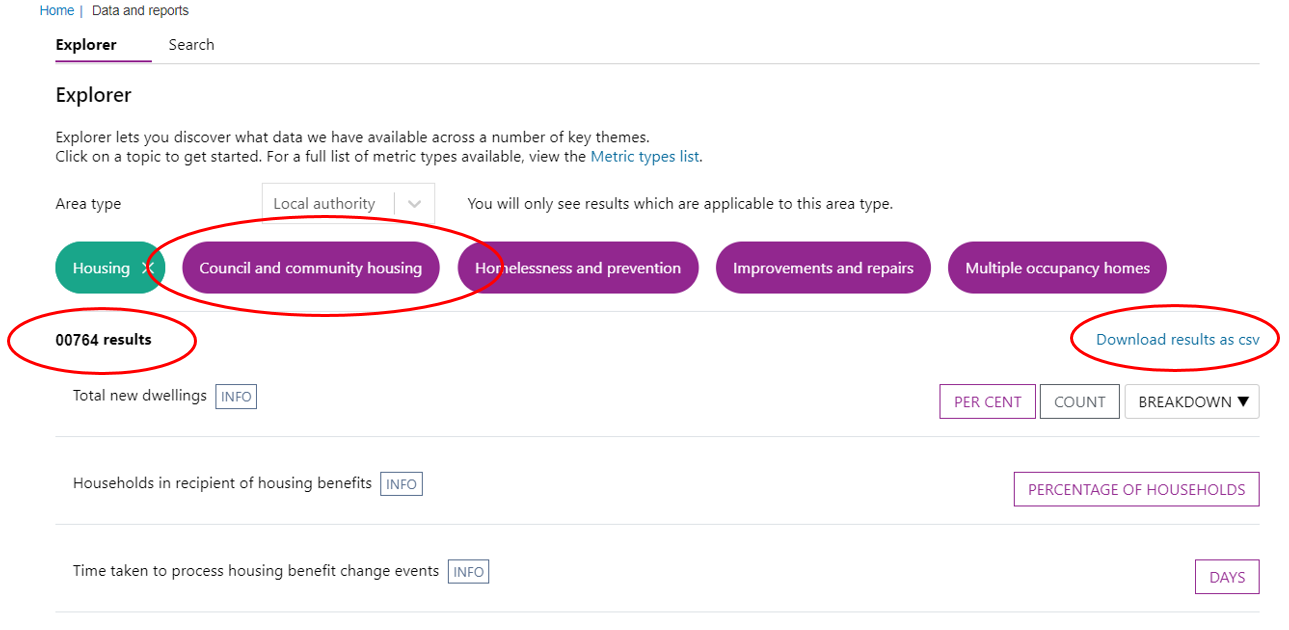
- Other search options may also be available within the initial search. Click on the available purple icons to see additional results.
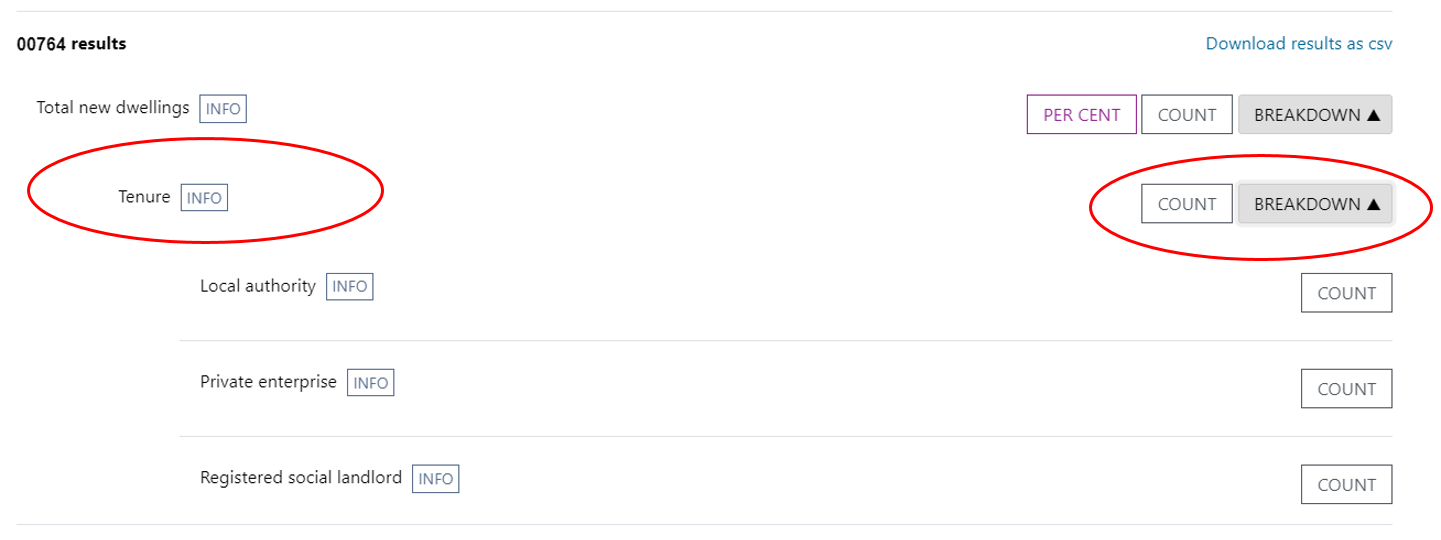
- The number of metrics available in this Search can be seen: e.g. 764 results. Also, a csv download, detailing all metrics available in the search, can also be used to get a full listing.
- Search results are shown at the bottom of the screen.
- Left hand side
- The Metric Name: e.g. Total new dwellings (short label)
- INFO: Click on the info icon to show the meta data associated with the metric. This describes key features such as the name of the metric collection.
- Right hand side
- Icons show whether the metric is available as a percentage or a count. Or, if the metric can be broken down further e.g. by gender. Click on these to see the data for the metric.
- Left hand side
Click on INFO to view meta data (click again to close).
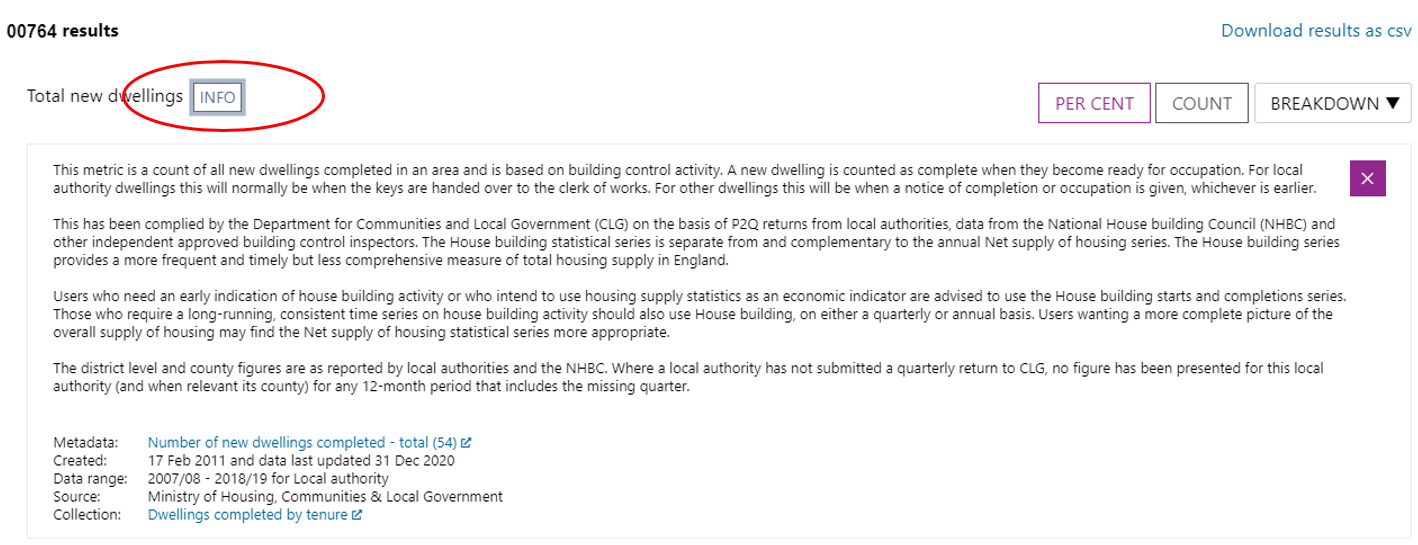
- Click on PERCENT to see the metric data
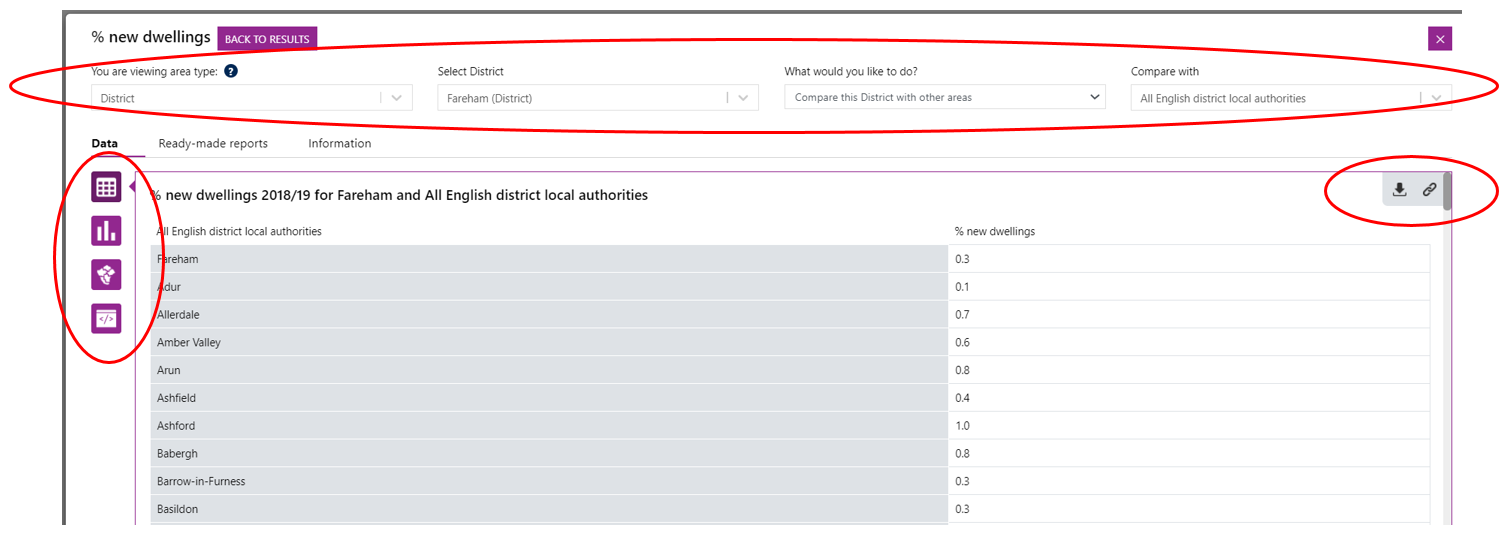
- Available features:
- At the top of the screen are four modifiers:
- Area type, Area Select, Area View and ‘Compare with’. These can be modified to see the data in different views.
- The four purple icons on the left allow the data to be viewed differently: Table (default view), Bar chart, Map and data feed.
- Download the data or link to it via the icons in the top right hand side of the table.
- View reports that are available for this data item click the ‘‘Ready made reports’ tab.
- At the top of the screen are four modifiers:
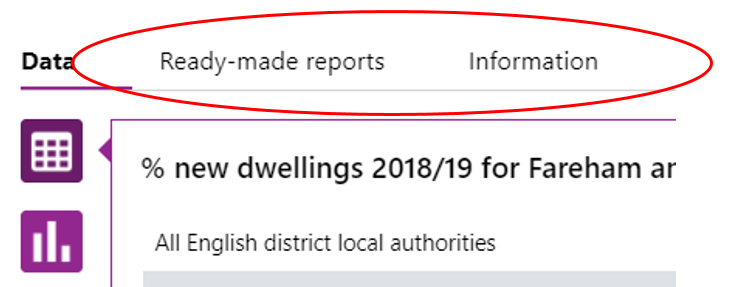
- View the metric description and meta data click on the ‘Information’ tab.
- Available reports are listed. Click on the title to open it. You will go to the LG Inform Standard Report. An example Standard Report is shown at the end of this guide.
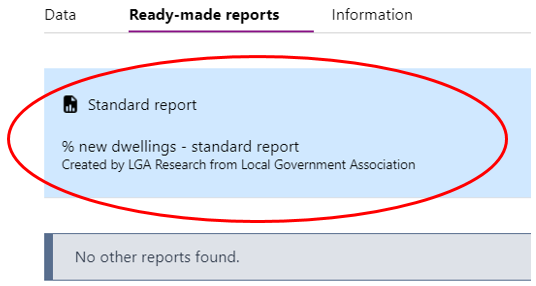
- To close this just click: ‘Back to Results’
- Click on BREAKDOWN to see further options:
- Click on Search to be able to search for individual terms e.g. obesity
- The Search function can be seen below:
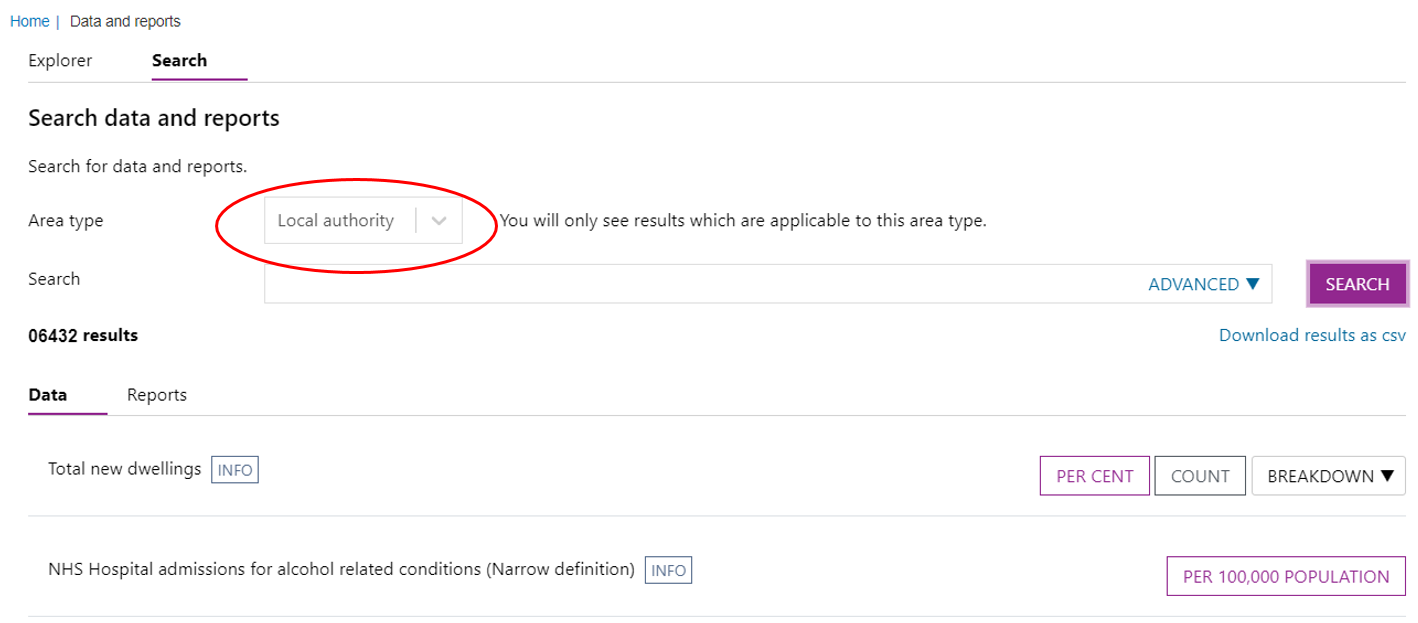
- Local Authority is the default area type. Other areas are available depending on how the metric data is made available. E.g. by Region.
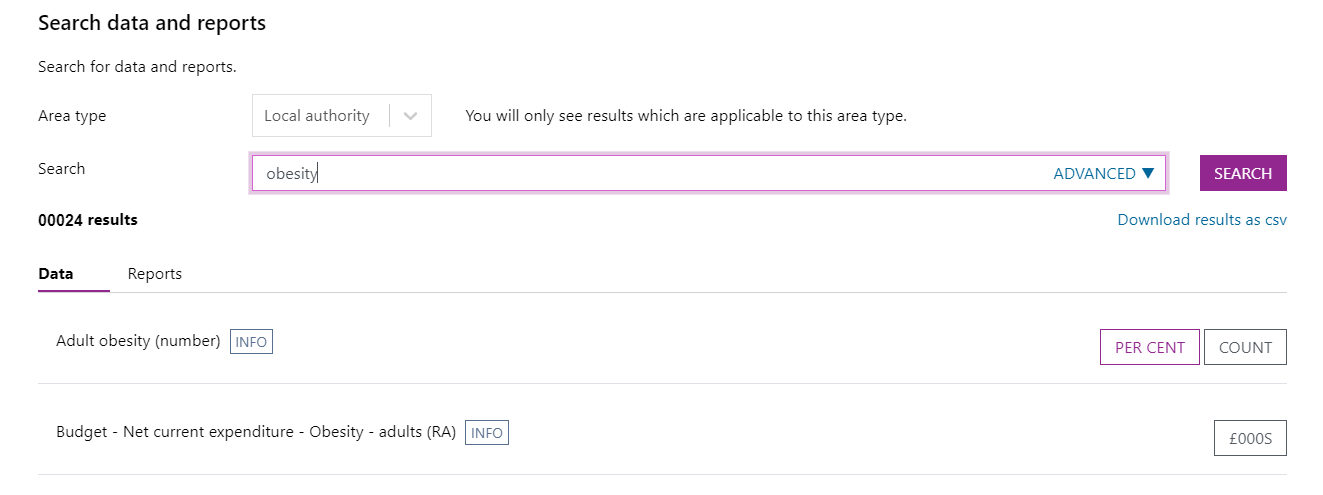
- Input your search term into the ‘Search’ bar e.g. Obesity and click ‘Search’ to get results.
- To see the meta data and data the Search facility operates the same way as the Explorer.
- There is an ‘Advanced’ function:
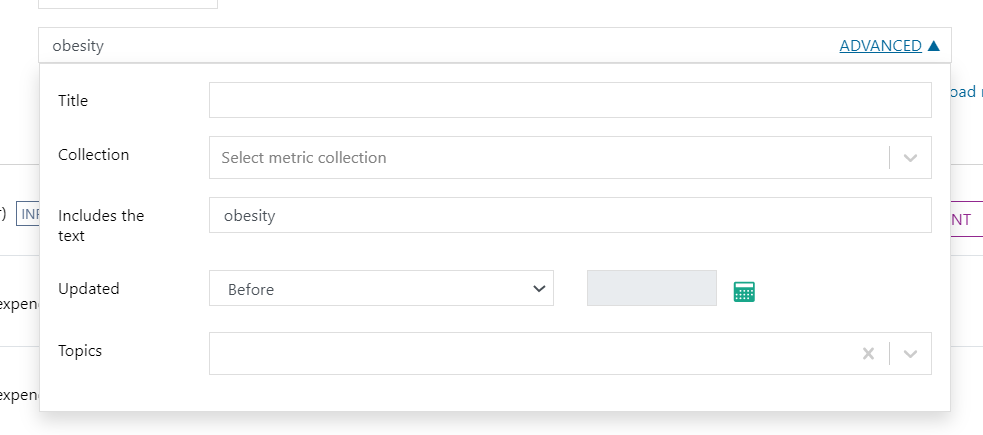
- Additional search functions are available to refine your search:
- Title: Use generic terms such as expenditure or population
- Collection: pick from the list of all collections in the database
- Includes the text: search on key words
- Updated: dates before, on or after to refine the period you are searching for.
- Topics: pick from a list of local government services to refine the search.
Back to top
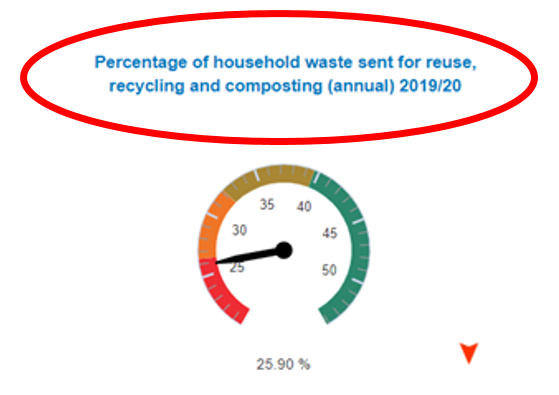
4. LG Inform Standard Report: an example.
- The LG Inform Standard Report for any metric is accessible from the ‘Home page’ by clicking on the blue hyperlink shown above the dials
- Each metric held within the LG Inform data base can be viewed via the same template.
- The template can be focussed on any local authority area, period or comparison where the metric is appropriate by using the top modifiers.
- Four modifiers are available to customise the report:
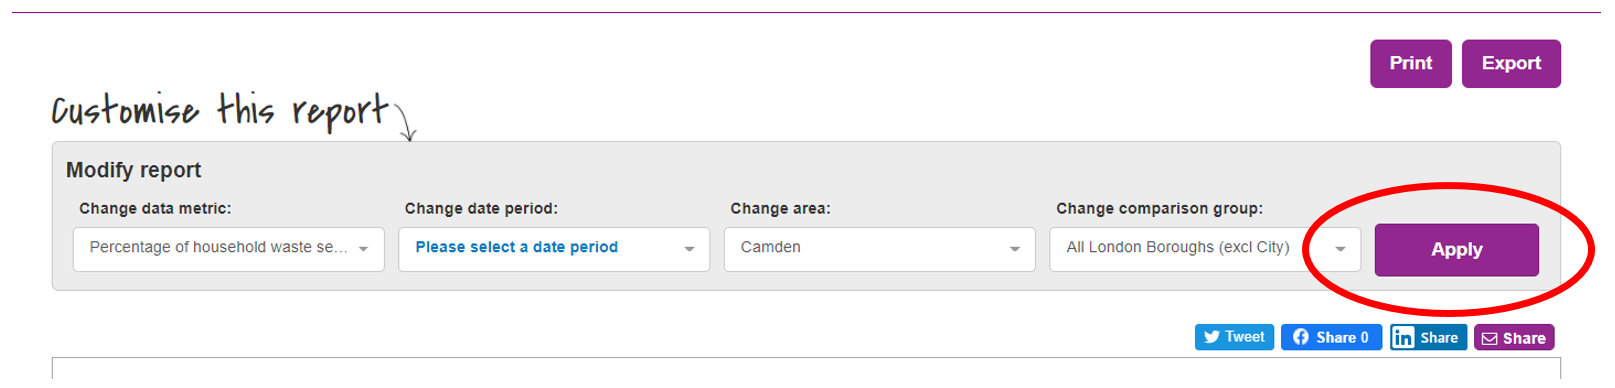
- Change data metric: This allows the user to search the database for different metrics
- Change date period: For here users can see the available periods for the metric.
- Change area: Any available local authority area can be selected
- Change comparison group: To benchmark, this modifier allows users to select from an extensive range of preloaded comparison groups e.g. Nearest Neighbours.
- Click ‘Apply’ to enable the changes and view the data item.
- It is possible to ‘Print’ or ‘Export’ the report and, also, to share it via a number of social media platforms.
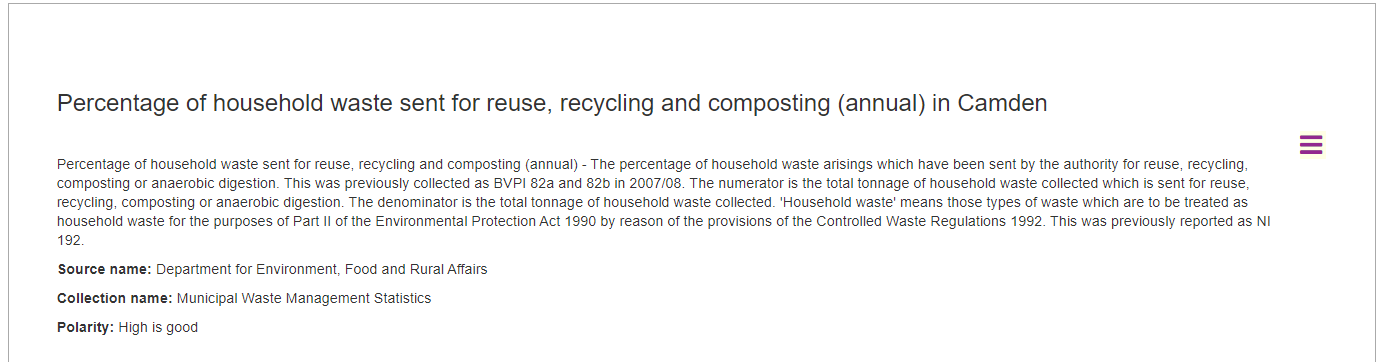
- The report is split into six segments (components) and by scrolling down the report a number of tables and charts are shown to visualise the data.
1. The Metric Metadata: this provides the definition of the metric, the source, collection name and what the ‘polarity’ is for the metric. E.g. a high value is good or a low value is good.
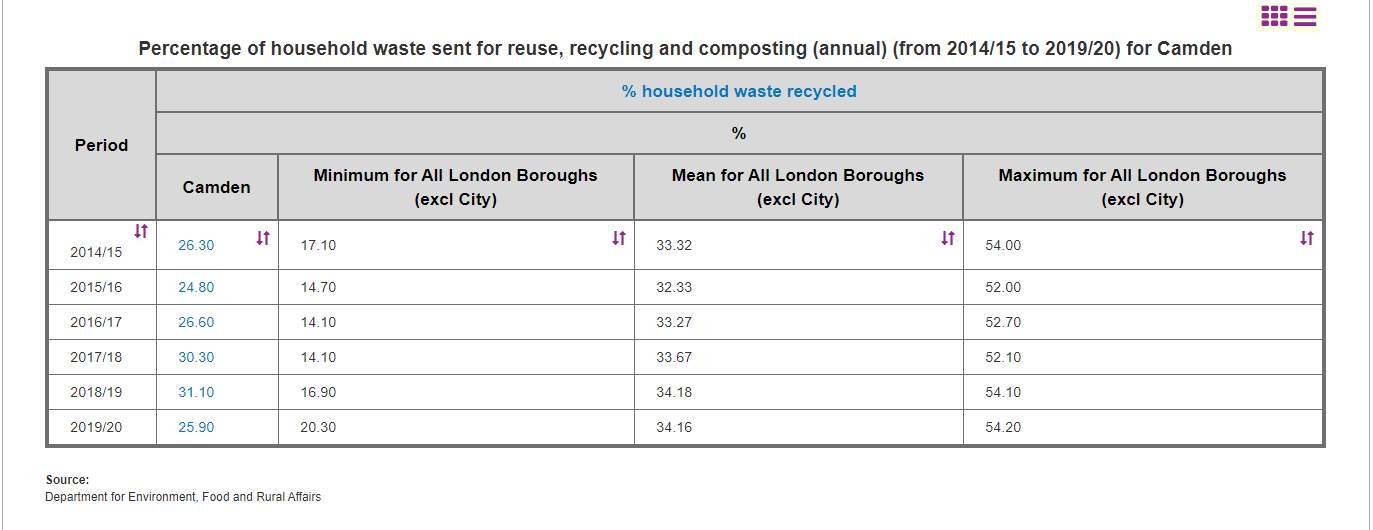
2. A basic comparison table: the table highlights the number of periods selected and the respective values for the local authority. The ‘Minimum’, ‘Mean’ and ‘Maximum’ values for each are shown referencing the ‘comparison group’ selected at the top of the report.
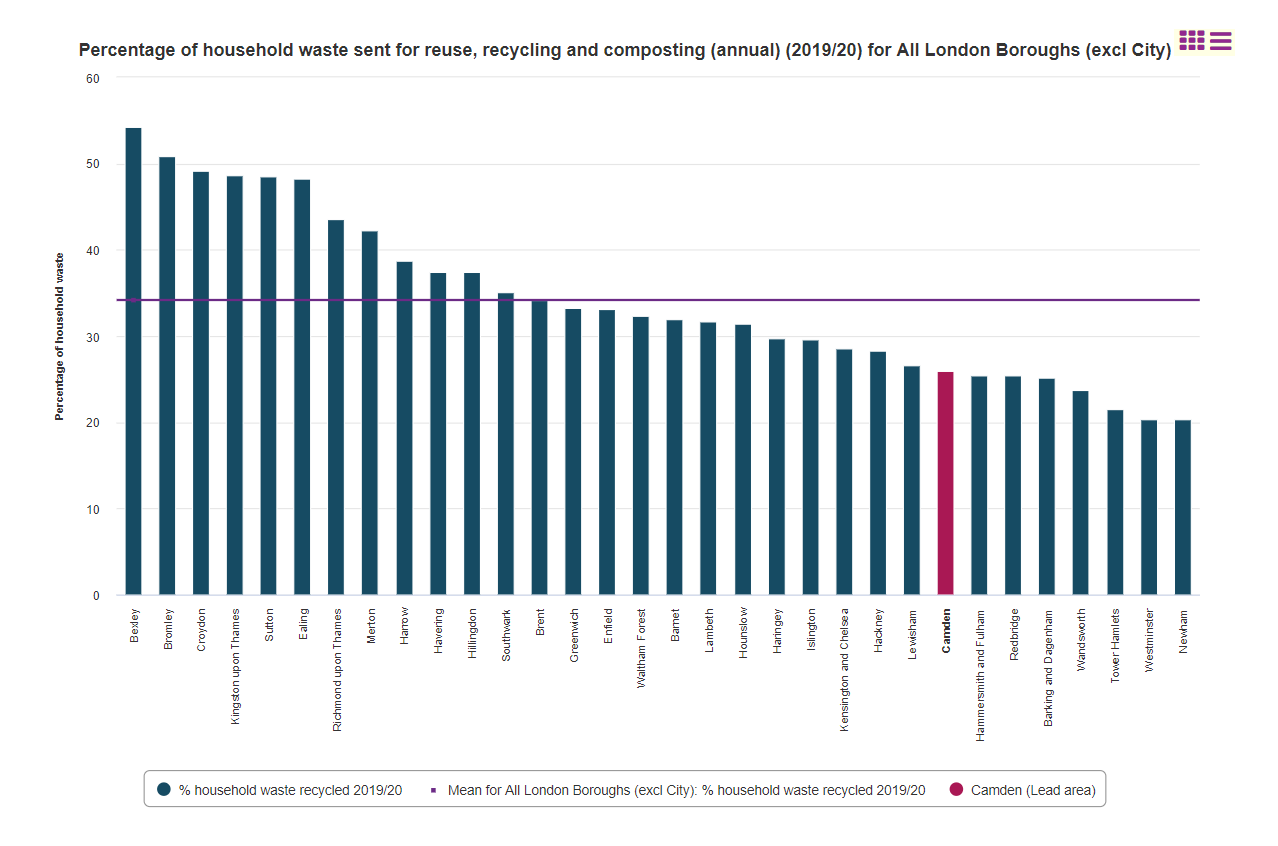
3. A bar chart: the bar chart shows the values for the lead authority (highlighted in purple) and for each authority in the comparison group. A ‘Mean’ line is drawn to show the relative positions of the authorities against this average.
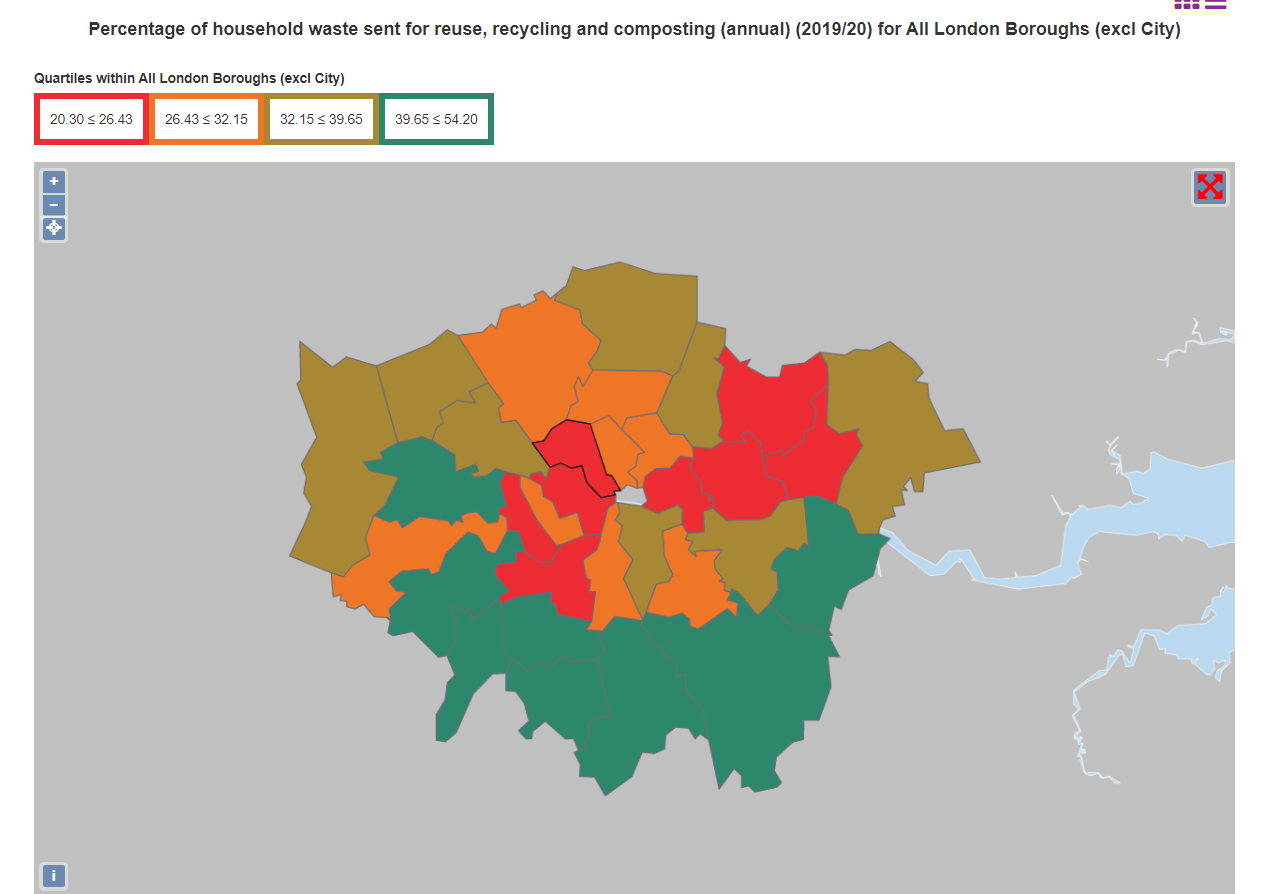
4. A Map: the map shows the data for all authorities in the comparison group within four quartiles with a colour for each. The lead authority map shape has a bold line.
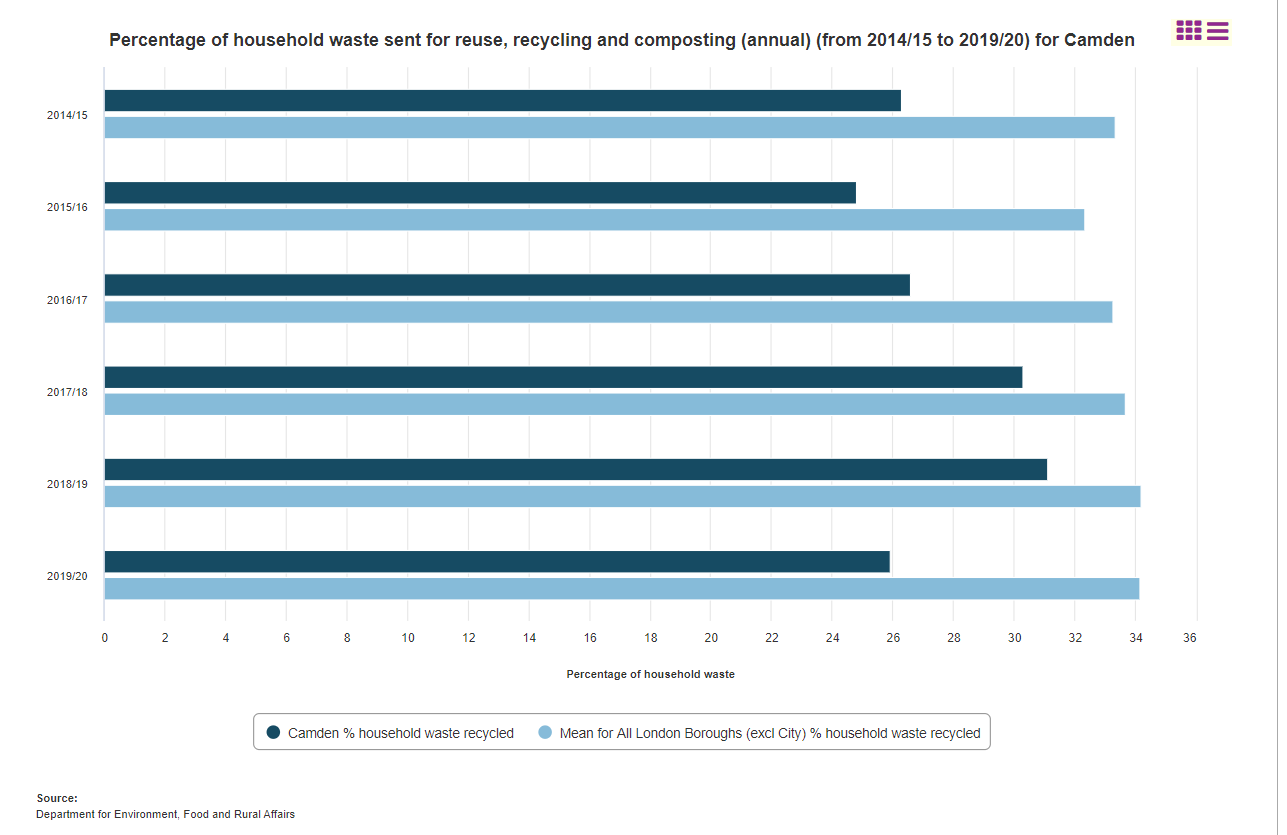
5. The data time series: the bar chart sows the lead authority value for all periods selected against the ‘Mean’ value for the comparison group.
6. The data selection: this table shows the data for each authority and each period selected. All columns can be sorted alpha-numerically.
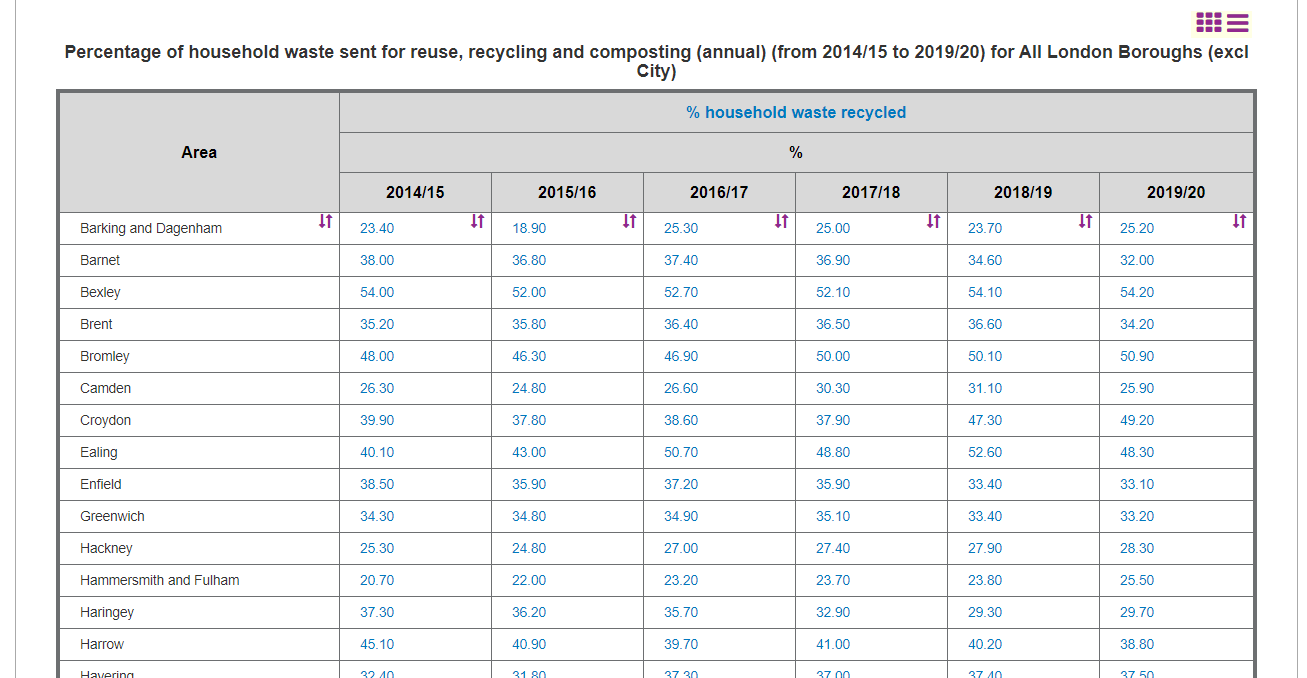
- To the top right-hand corner of each report section (component) there are two purple icons:

- These enable the user to change the view of each component and also export the component in a variety of formats.
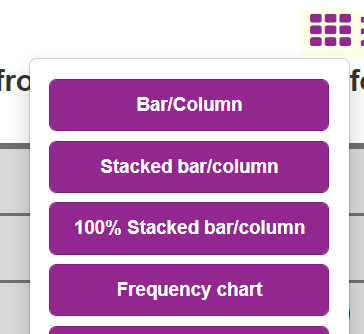
- The Change Component icon:

- By clicking on the above icon, numerous options are available to change the component type e.g. from a Bar chart to a line chart. Just select which you are interested in and the component will change accordingly.
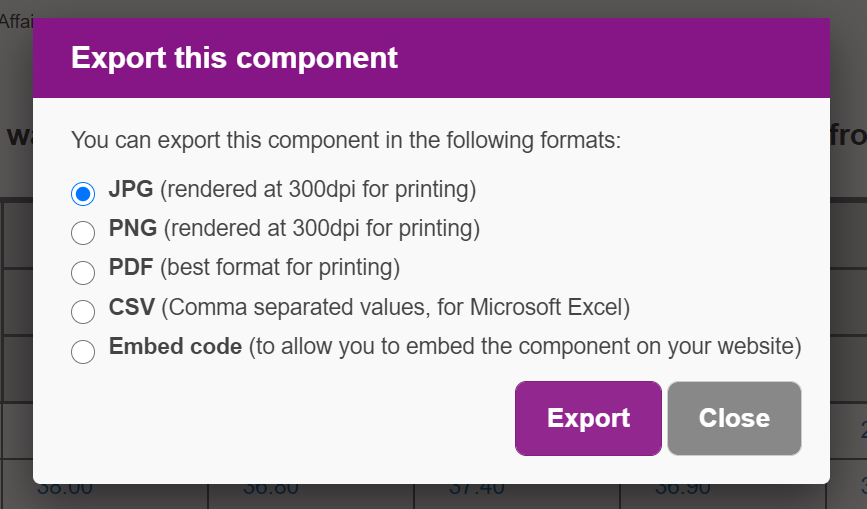
- The Export icon:

- By clicking on the above icon the following options are available to users to ‘export’ the component. As:
- A JPG
- A PNG
- APDF
- A CSV
- Embed Code
- Just select which you require and click ‘Export’.
- Embed code allows you to locate the component (or a full report) as an active chart, table or map within your website. If ‘Embed code’ is selected additional steps will be presented as follows:
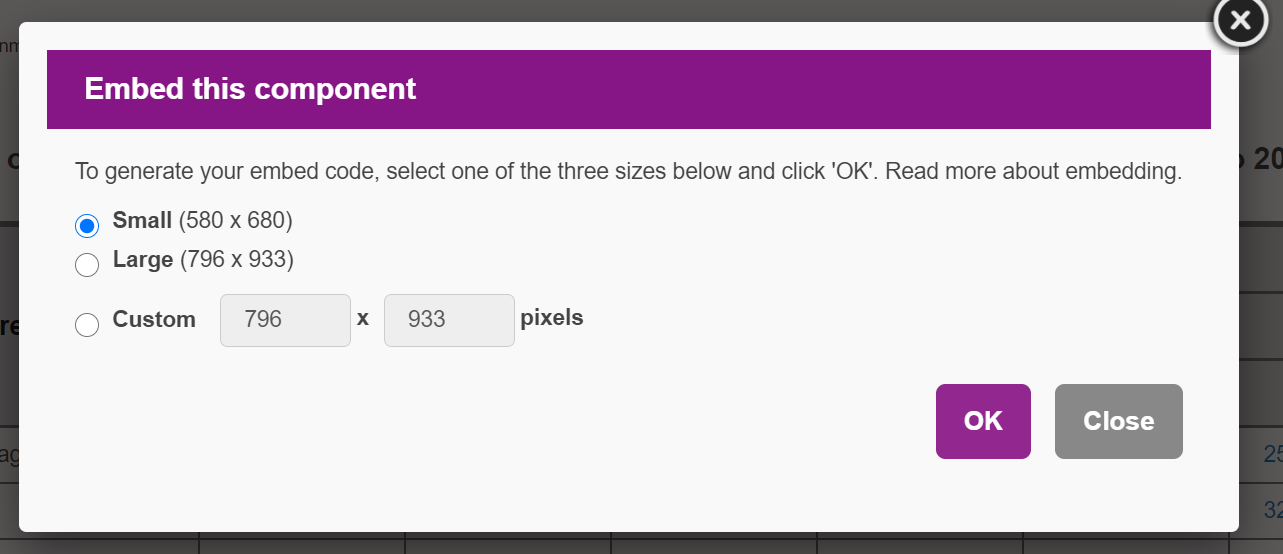
- Users are requested to determine the size of embed required. Typically, ‘Large’ is for websites with ‘Top Navigation’ and ‘Small’ is best where there is ‘Side Navigation’. For those unsure, there is also a ‘Custom’ option too. Select which you require and click ‘OK’.
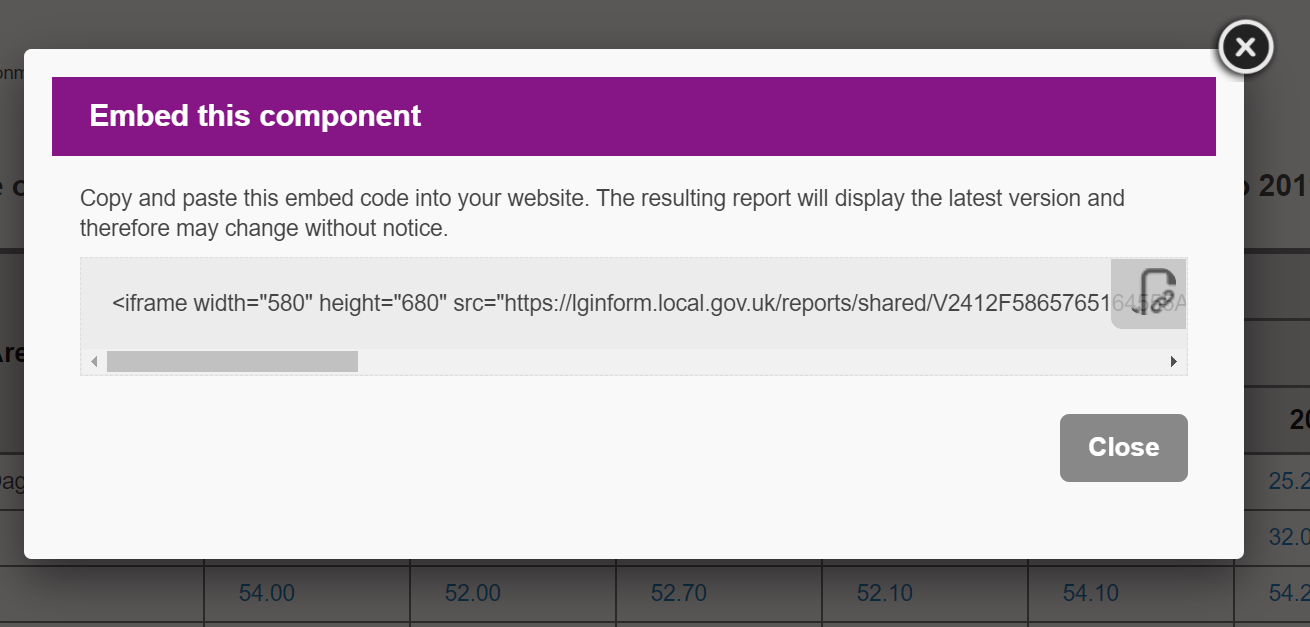
- The Embed code is generated instantly. Use the highlighted ‘copy’ function to ‘grab’ the code and send it to your webmaster for deployment. The component will be live and when the data is updated the component will change accordingly.
- These icons allow you to use ‘Social Media’ or to email a copy of this report to colleagues.

© Local Government Association, June 2022
Back to top