LG Inform Plus API (Application Programming Interface) Help Guide
What is an API?
An application programming interface (API) is a way for developers and data analysts to ‘talk’ to an application, website or database. It can be as simple as getting the weather forecast from a weather API or it could be more advanced, such as auto-publishing a picture to your Facebook or Twitter account.
APIs are built to be used by developers, primarily, and data is provided in JSON, XML and other formats. However, you shouldn’t be scared to start using an API as services exist that will help you get around the technical aspects, for example, Zapier or Bubble. We have also built user-friendly tools to help you use our API, which we will cover in this guide.
Back to top
How do I access the API?
To use the API, you will need to register for security keys. Keys are used to identify who is using the API – a bit like a username and password – and apply limits to the total amount of data you can access. It is important that you do not share your keys or make them visible in any code, so others don’t start using your keys and your data allowance. (If someone else from your organisation has already registered a key, you will all share that key and some data may have been consumed already.)
To register for security keys follow these instructions.
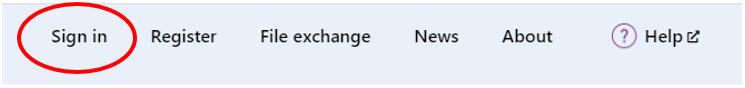
- Sign up for LG Inform Plus or sign in to your account.
- Visit the API section of our website.
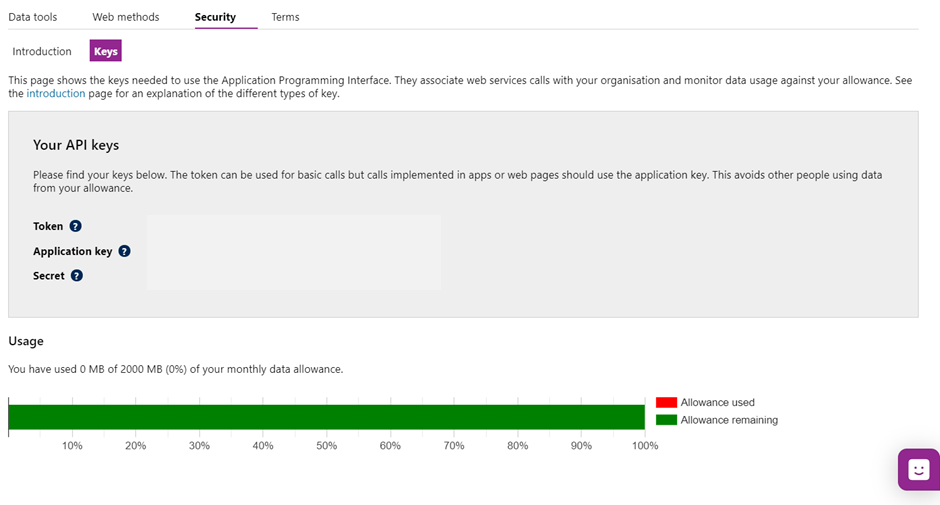
- Click ‘Security’ in the left-hand menu.
- Click ‘Keys’.
- Check the checkbox to agree to the terms and conditions, then click ‘create keys’.
You’ll now see your keys displayed on the page.
Back to top
Quick start: using the data tool
Now that you have your security keys, you can start using them with the data tool. The data tool allows you to draw data from our database without needing to build reports or view charts and tables. You can also use it to build web methods, ready to be inserted into any applications you’re building.
First you must sign-in to LG Inform Plus here:
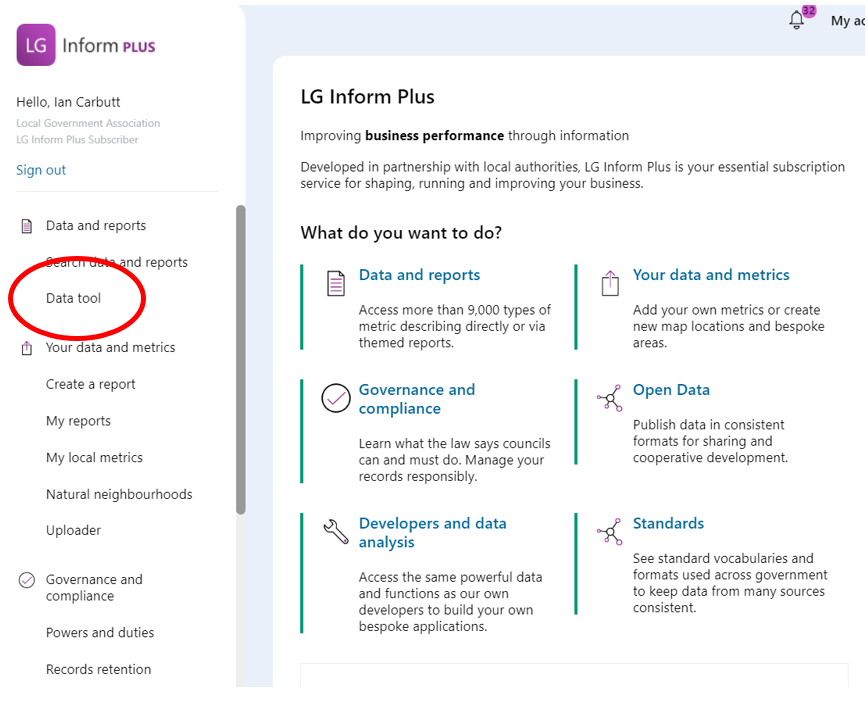
You can find access to the Data tool using the navigation from the left-hand side menu. Hover your mouse over ‘API’ and click ‘Data tool’.
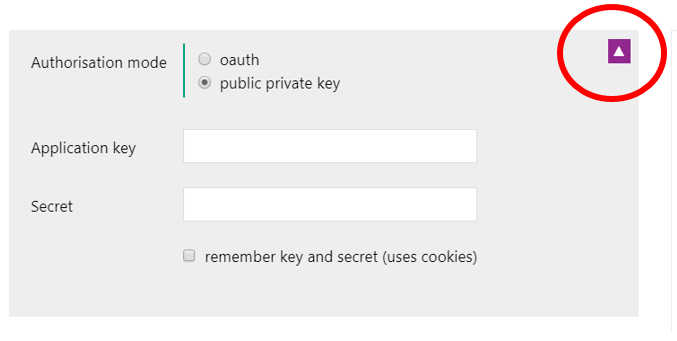
If you don’t sign in, but have an ‘application key’, just go straight to the data tool and use the dialogue box below.
Enter your application key into the application key text box and enter your secret into the secret text box. Close the box by using the arrow in the top left corner.
Detailed information on how to use the Data tool and further help is available here:
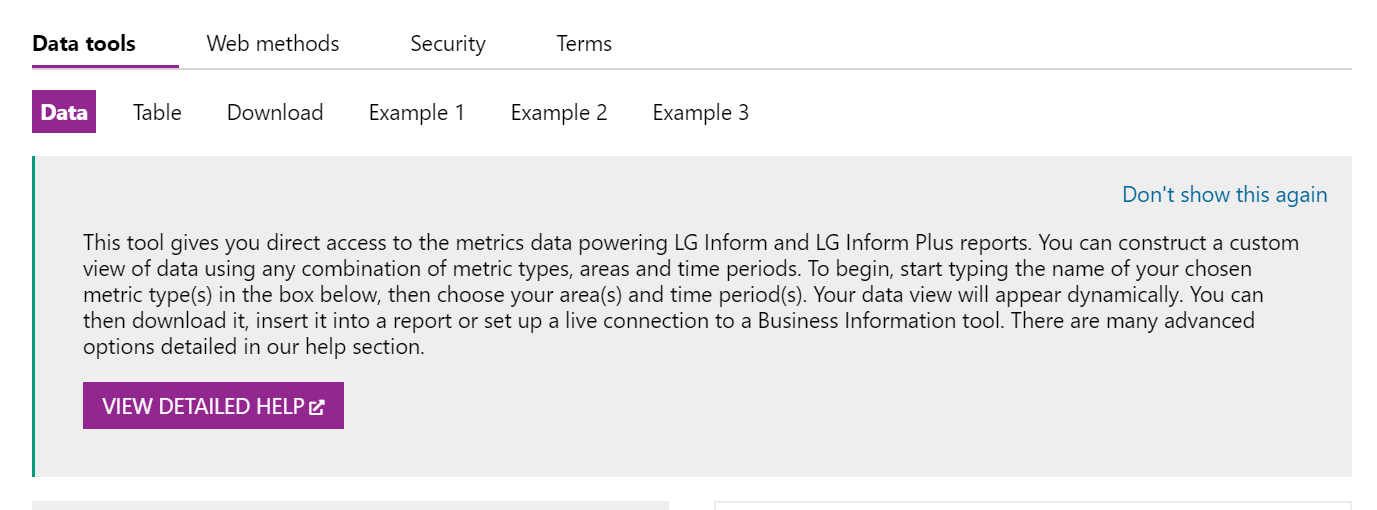
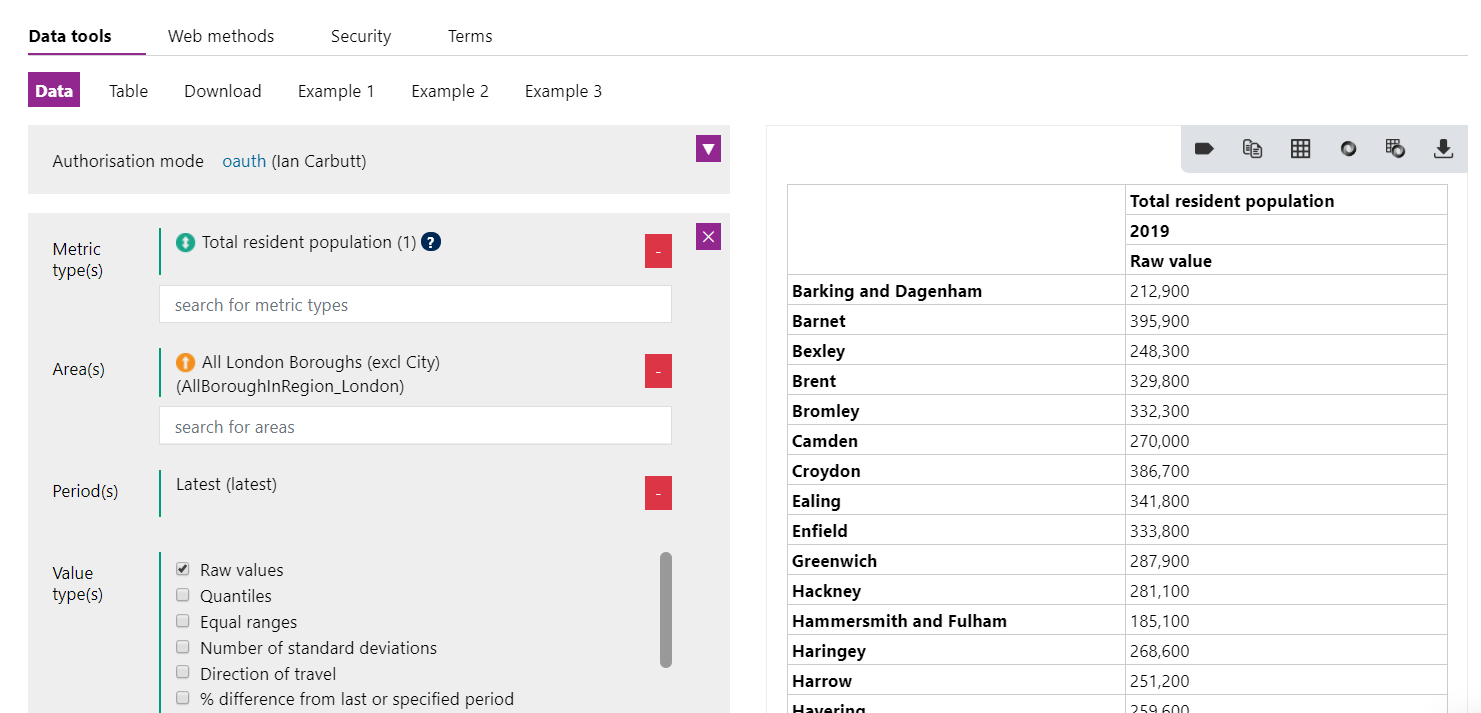
We will use this dialogue box to create a data query:
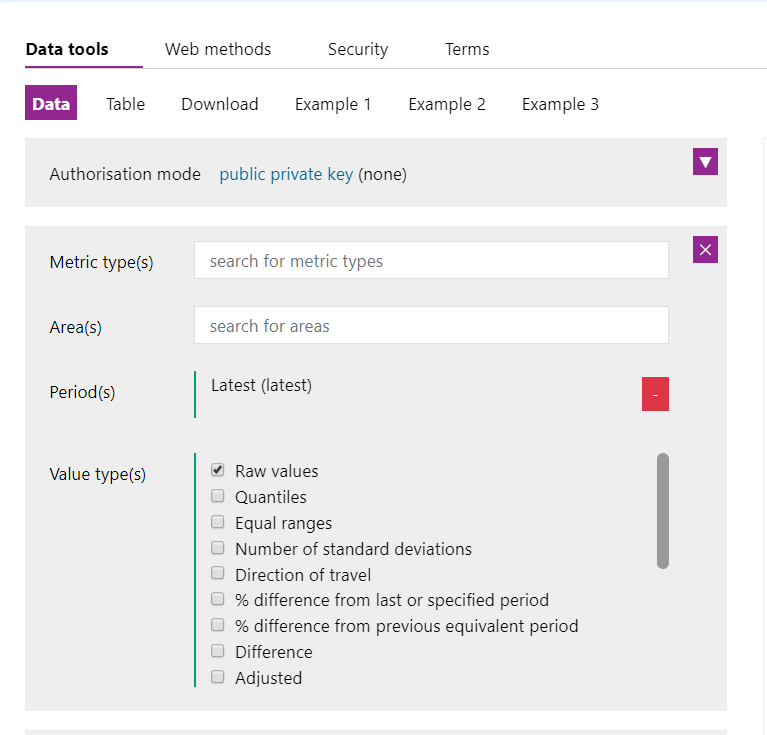
First enter a metric type, then an area and finally a period to start seeing data. Follow these instructions to see data using the data tool:
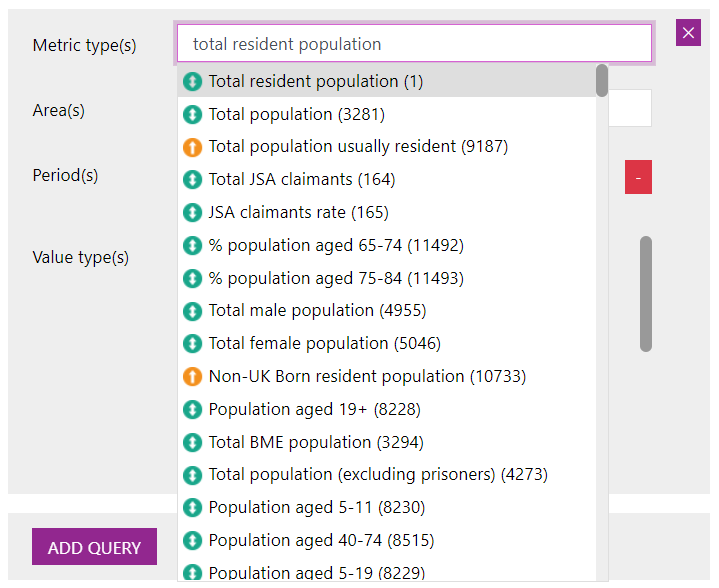
- In the 'metric type(s)' field, search for a metric type and click it to add. You can add multiple metric types. E.g. ‘Total resident population’. Note: Downloads of all metrics available within the data base can be found here.
- In the 'area(s)' field, search for an area to add. Choose an individual area, e.g. local authority or numerous areas such as English Regions e.g. All London Boroughs excluding City. Just select them from the list. Multiple areas can be added.
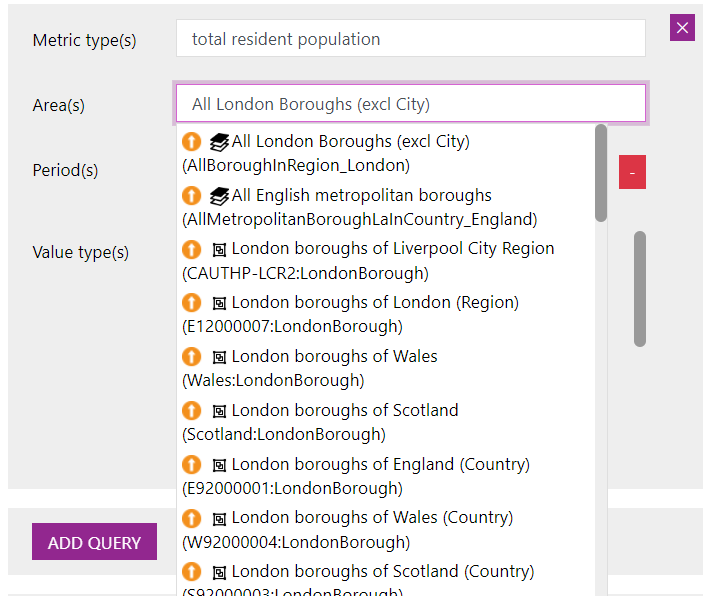
The red box, to the right of your selection, allows you to delete your selection and start again
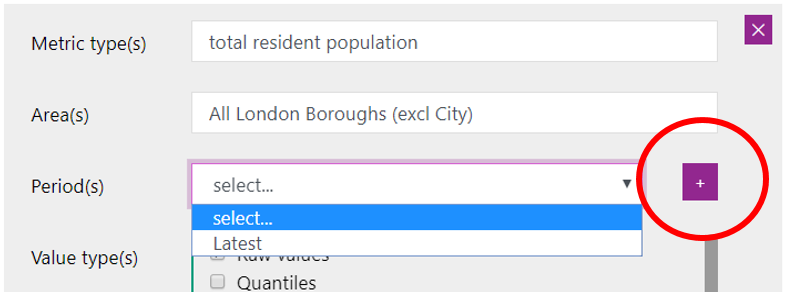
- Select a time period. 'Latest' is seen selected by default but click the red box
 to delete it and choose it again (or another from the dropdown). Click the purple ‘+’ button. This action ‘fixes’ it in place. You can add multiple time periods.
- Select the value types to display. Raw values are displayed by default. Use the checkboxes to select other value types, which can be useful when displaying several areas at a time, e.g. rank.
Note: Selections can be fully deleted by using the purple cross at the top right of the above diagram. The dialogue box will close and need to be opened again.
Your query should then appear. See below:
To change any of the three parameters, just run through the sequence again.
Further functions are available to users:
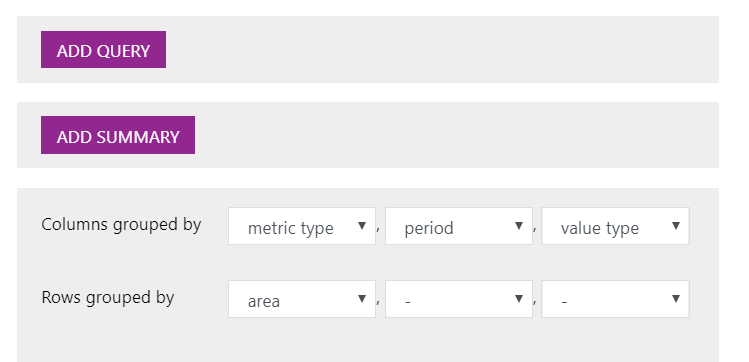
- Use the 'add query' button to add another query, for example, to compare metrics with different time periods (calendar year against academic year).
- Use the 'add summary' button to add a summary value, e.g. total, median, mean, etc. For example, if you’ve selected total resident population of neighbourhood plan areas in London, select mean to see the average population of neighbourhood plan areas in London.
- Use the final box to alter how columns and rows are grouped. By default, areas that do not have values for the metric type will be excised from the result but you can include those using the 'include missing' checkbox.
As the data tool allows you to build queries and see the results instantly, it is the most accessible option for using the API. Try playing around with the tool until you are happy with the results.
The buttons situated on the top-right corner of the table are useful.
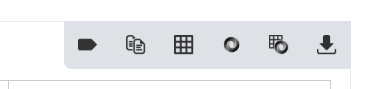
From left to right:
- Toggle Labels or IDs
- Copy a link to the clipboard
- View link to HTML table
- View the JSON
- View the JSON table
- Download to csv
Let’s take a look at web methods, a more advanced and the most common way to use an API.
Back to top
Quick start: using the web methods tool
The web methods tool will help you call data from the API using web methods and sign those calls with your keys. In plain English, web methods are the language you use to talk to the API. You will see that they ask the API for certain responses in specific ways. When you construct a web method, it calls on the API to return what you have asked for.
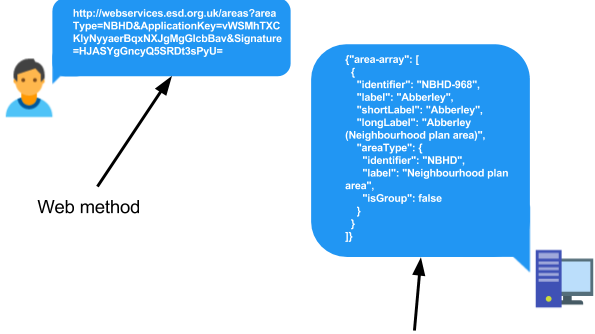
In the picture above, you can see that your web method calls the API to return a response. You can also see the response it returns (in JSON format). It might sound obvious but you will need to know in advance what you want to get from the API and how you will process the response.
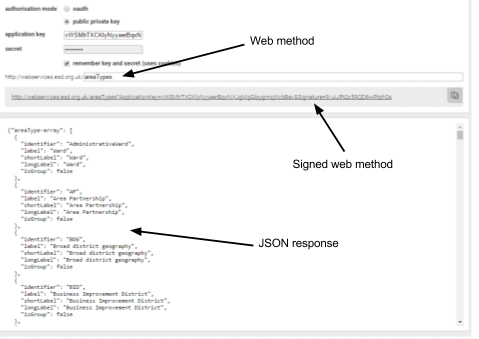
Enter your application key and secret into the web methods tool in a similar way to last time and it will automatically sign your calls for you.
The web methods list shows you every type of web method you can use and the parameters you can use to customise the call. Each web method is explained and an example given. If you do not use the parameters to customise your call, a default response will be returned.
For example, you can use
- /metricTypes to see a list of metric types (see example)
- /areaTypes to see the types of area (see example);
- /areas?areaType=County to see a list of counties (see example);
- /periodsTypes to see types of period, e.g. calendar year (see example);
- /periods?periodType=CalendarYear to see the actual periods of type ‘Calendar Year’, e.g. 2016 (see example); and
- /data?metricType=1&area=E10000002&period=cal_2015 (see example) to see a metric value for metric type 1 (Total resident population), area E10000002 (Buckinghamshire) for period cal_2015 (calendar year 2015) – in plain English, the total resident population of Buckinghamshire in 2015.
Type a web method into the web methods tool and you will see the response. You will also be able to copy the automatically signed link to insert into your application.
The web methods tool will help you learn the syntax of data calls that you might later want to build up programmatically. Examine the JSON response of your calls so that you can process it in the routines you build for applications. We have also created some HTML and PHP examples to show you how to call the API from websites you are building, which includes instructions on how to sign calls on the fly (at the moment the call is made).
Back to top
Quick start: Discover data for an area
The quickest way to get started using the API is to discover what data are available for where you live. It will ll show you how to make calls to find areas and metric types, allowing you to learn how web methods work and the results they return. Follow these instructions to find data for your local area.
- Sign in to your LG Inform Plus account.
- Visit the web methods tool.
- In the text box, enter areas?searchText= followed by your home or work postcode.
- You should see some results in the box below. The system will have picked the local authority which your postcode falls within. Make a note of the identifier, e.g. E07000196.
- Delete the web method from the text box.
- In the text box, enter metricTypes/filter-data?area= followed by the identifier you made a note of.
- The system will now run a search and retrieve the metric types which are applicable to the area you selected. It will also show you at which level of geography data is stored at, as well as the latest period for which we have data.
A combination of the areas?searchText and metricTypes/filter-data calls should help you discover data in the API with which you can build data dashboards and applications.
Back to top
Reference pages
- API home page – http://api.esd.org.uk/
- Web services root call – https://webservices.esd.org.uk/
- “Explain” page for all web methods – https://webservices.esd.org.uk/explain
- Page documenting each web method with examples – http://developertools.esd.org.uk/methods
Back to top
Building an application
As we mentioned before, services exist to help you get around the technical aspects of using an API. You have already seen how to use the tools we’ve created, but let’s take a look at Bubble which helps non-programmers build applications. It is what we used to build Ward Check, a simple application to tell you which ward you live in based on your post code.
The user enters a post code into the application (Ward Check). The application then inserts the user’s input into a web method and makes a call on the API. The API returns a response to the application, and the application takes elements from this response and displays them to the user.
For example, if you enter ‘SW9 8BJ’ into Ward Check, it will show you the corresponding ward.
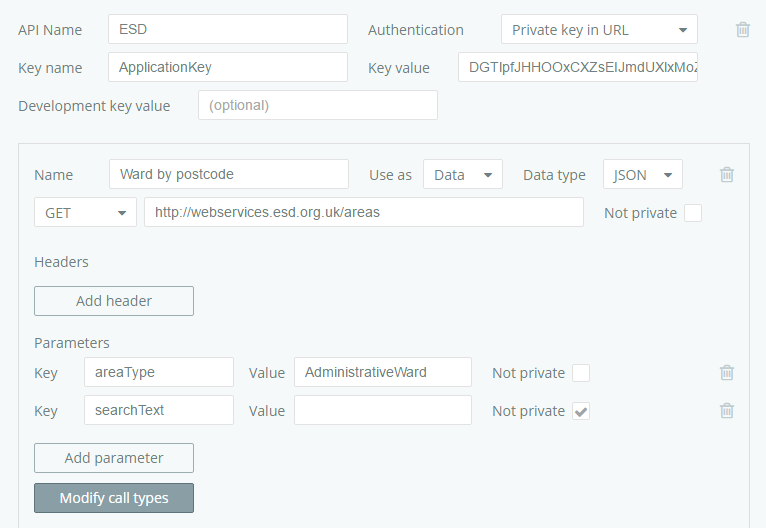
The application makes use of the /areas method and its areaType and searchText parameters. In the backend, the following call is waiting to be made.
The search Text parameter is left blank because we are waiting for the user to input a post code, and once they have it will be appended to the call. Here’s how the API has been plugged into the back end of Ward Check.
And here’s how the front end of Ward Check looks in Bubble.
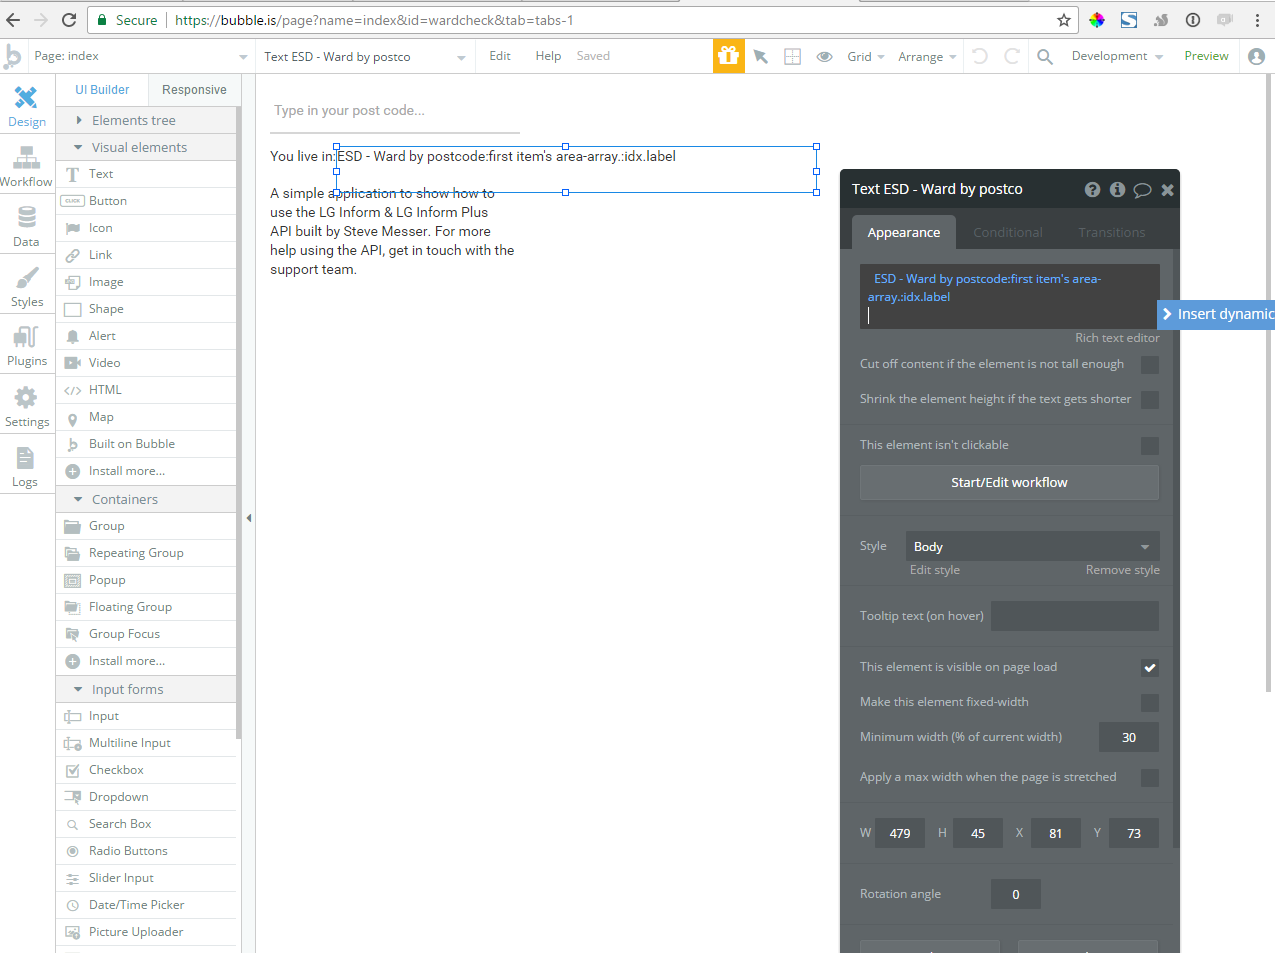
You can see that the highlighted text box will make a call to our plugin – ESD Ward by postcode – and return the first item’s label, which in plain English is the name of the first ward in that post code.
Bubble’s visual programming allows you to build applications without learning a programming language and has other plugins. For example, we could use the Google Places plugin to show a map of the user’s post code. You could also show a chart to display the population over time of the user’s post code, but you’ would need to store values and use them in other calls.
Back to top
Need more help?
We hope you found the introduction to the API useful, but if you have any further questions use the help link below:
Use the Help link in the navigation bar anywhere in LG Inform Plus to read through our online help guides, or send an email to support@esd.org.uk and the support team will get back to you (Monday – Friday, 9 a.m. to 5.30 p.m.).
Back to top