LG Inform Plus 'My Local Areas' component Help Guide
Getting started
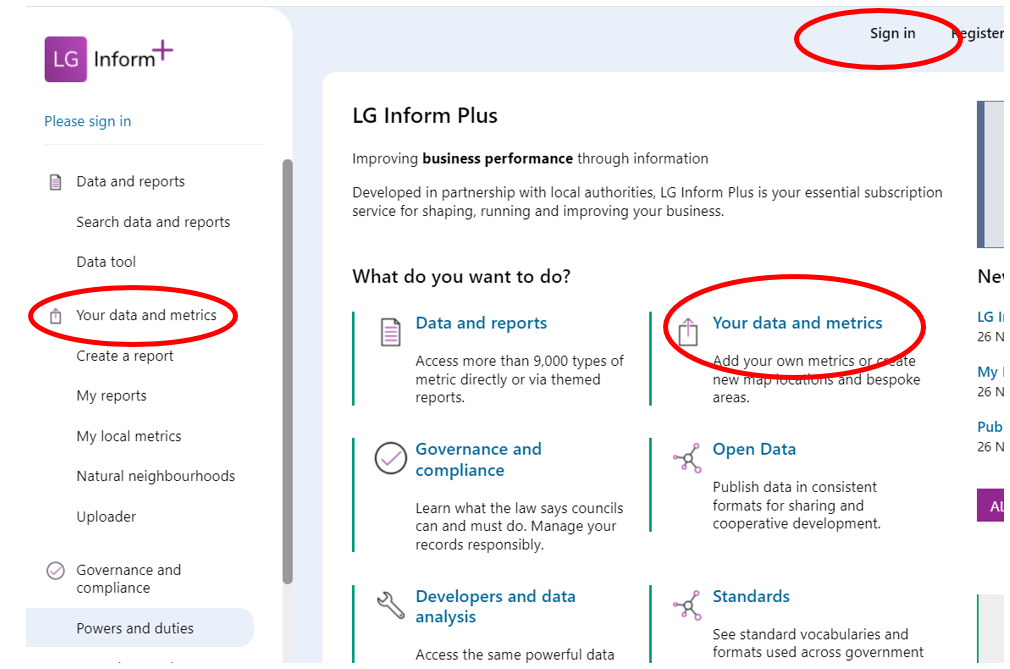
First users must be registered and able to ‘sign-in’. To find the ‘My Local Areas’ mapping component navigate from the landing page via ‘Your data and metrics’.
Back to top
Create an area
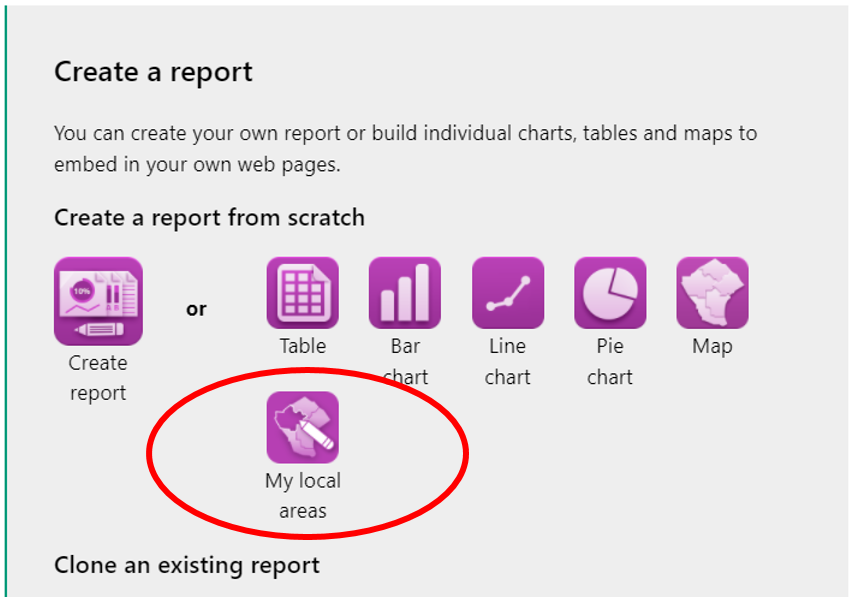
On the ‘Hub page’ you will see a series of icons under the ‘Create a Report’ area. Select the ‘My local areas’ icon.
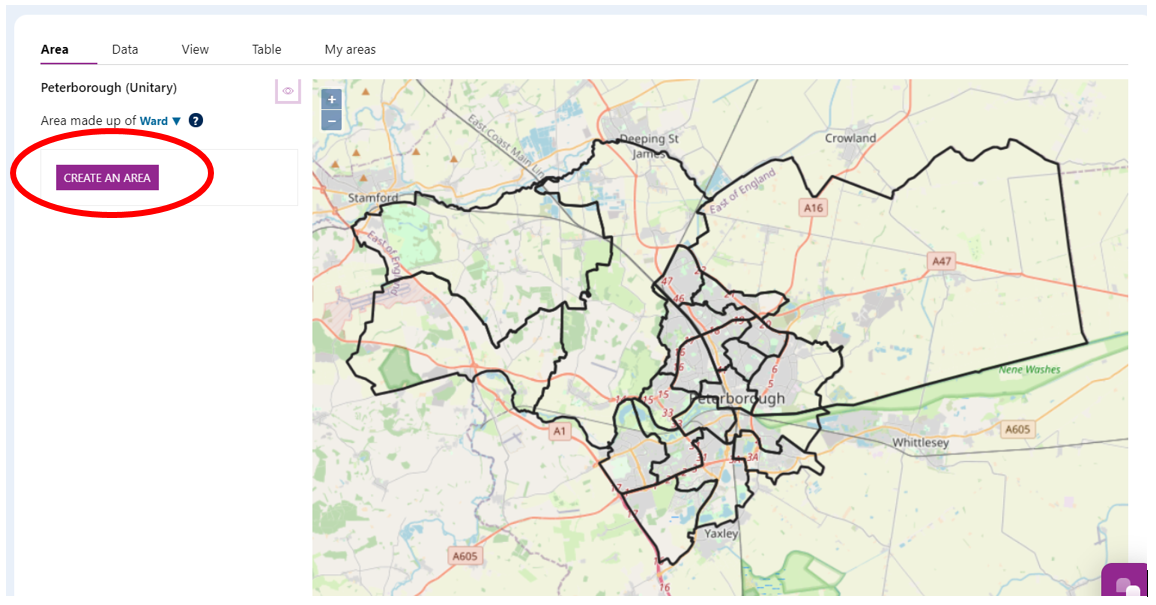
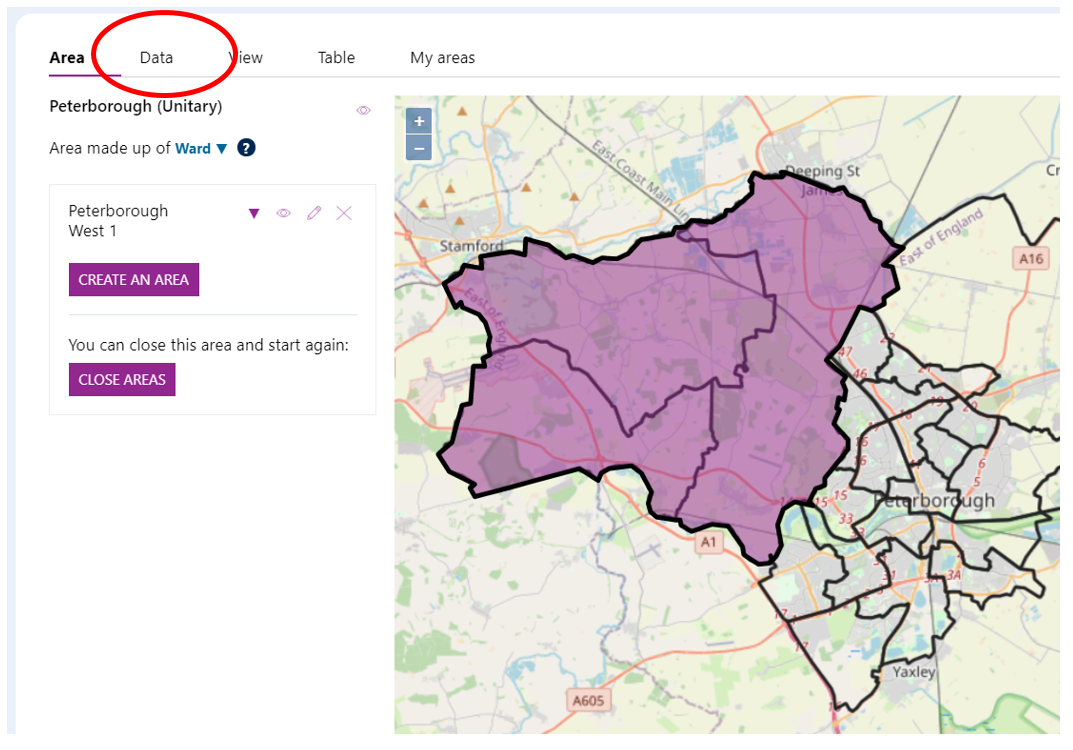
My local areas will open to show an unpopulated map of your local authority area. E.g Peterborough as below. Initially ‘Wards’ will be selected as a breakdown of your area. But LSOA or MSOA can be selected via the drop down underneath the authority name.
To proceed and create your new area(s) click ‘CREATE AN AREA’
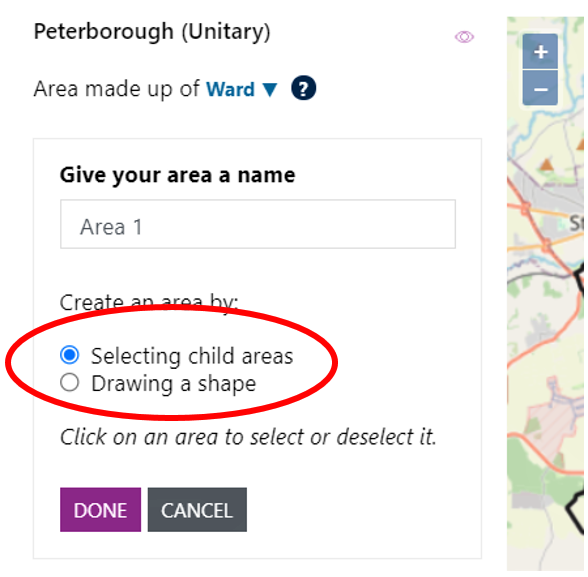
There are two options available to create an area. These are shown below.
Users can either create an area by ‘Selecting child areas’ (for example Wards) or by ‘Drawing a shape’ on the map where they would like the area to be. If the second option is used the system will select the most appropriate Wards, LSOAs or MSOAs that fit within that shape.
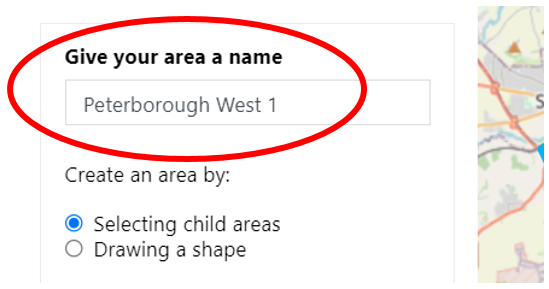
You can name your area in the ‘Give your area a name’ dialogue box.
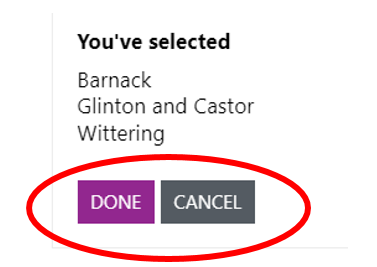
In the example below three Wards were selected. They are displayed below and a boundary drawn around them.
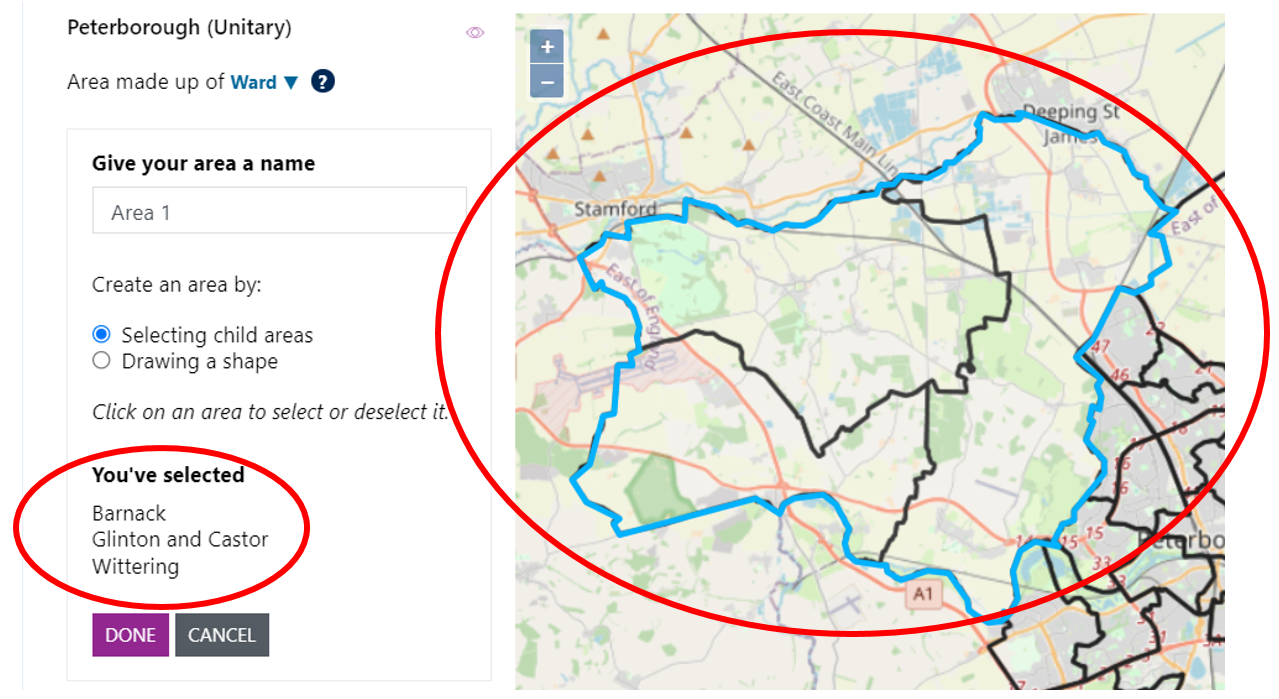
This new area can be named.
Once you are happy with the area click ‘DONE’
The map below shows the map image post the creation and naming of the first area in a set.
The area can be edited by clicking the pencil icon. More areas can be added to this map by clicking ‘CREATE AN AREA’ again.
Alternatively, this area can be saved and users can start again via the ‘CLOSE AREAS’ button.
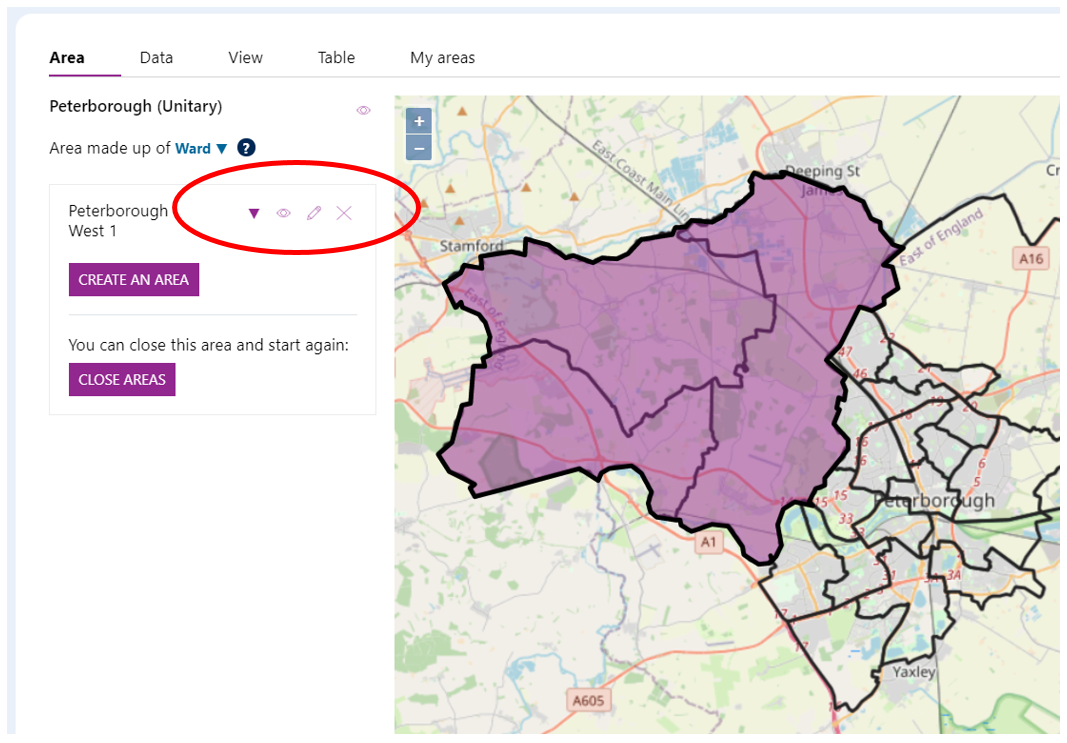
Once happy with your area(s), users can progress to the next stage of adding data. Click the ‘Data’ tab to move on.
Back to top
Add data
The data tab allows you to add data to your new area.
At the top of the left-hand pane there is a window into the database. Users can ‘Select metric type’ or CLEAR METRIC TYPE’. To select a metric type just type a key word or words into the dialogue box. For example: Total resident population. Universal credit, Deprivation.
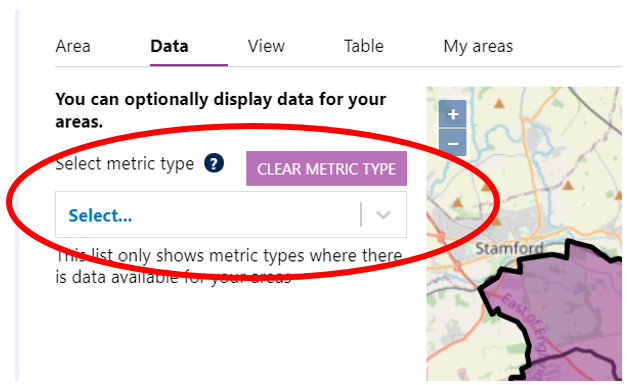
A drop-down list of metric types matching the chosen keyword(s) will appear for users to select from.
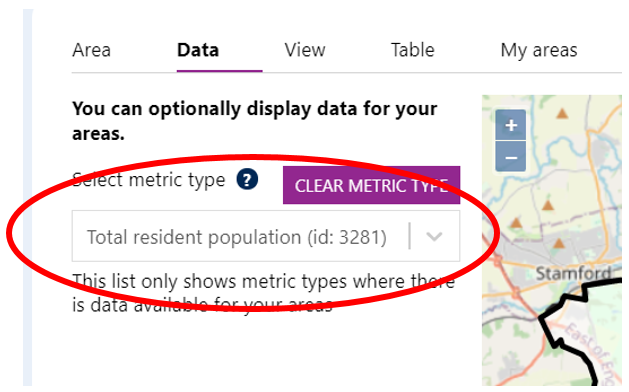
Once selected the map will be populated with the data. It can be previewed via the ‘View’ tab.
Back to top
View your area
The View tab allows you to view your area fully and use it in your work.
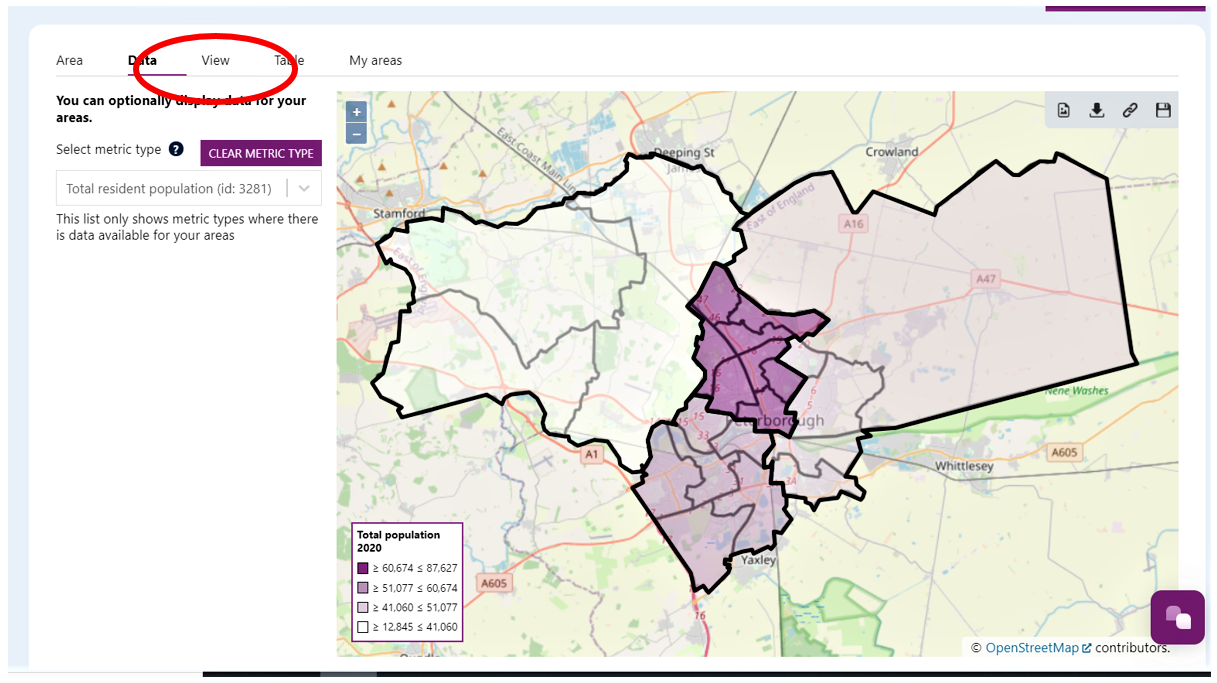
When in ‘View’ mode a number of options are displayed on the map to enable users to apply the component to their work
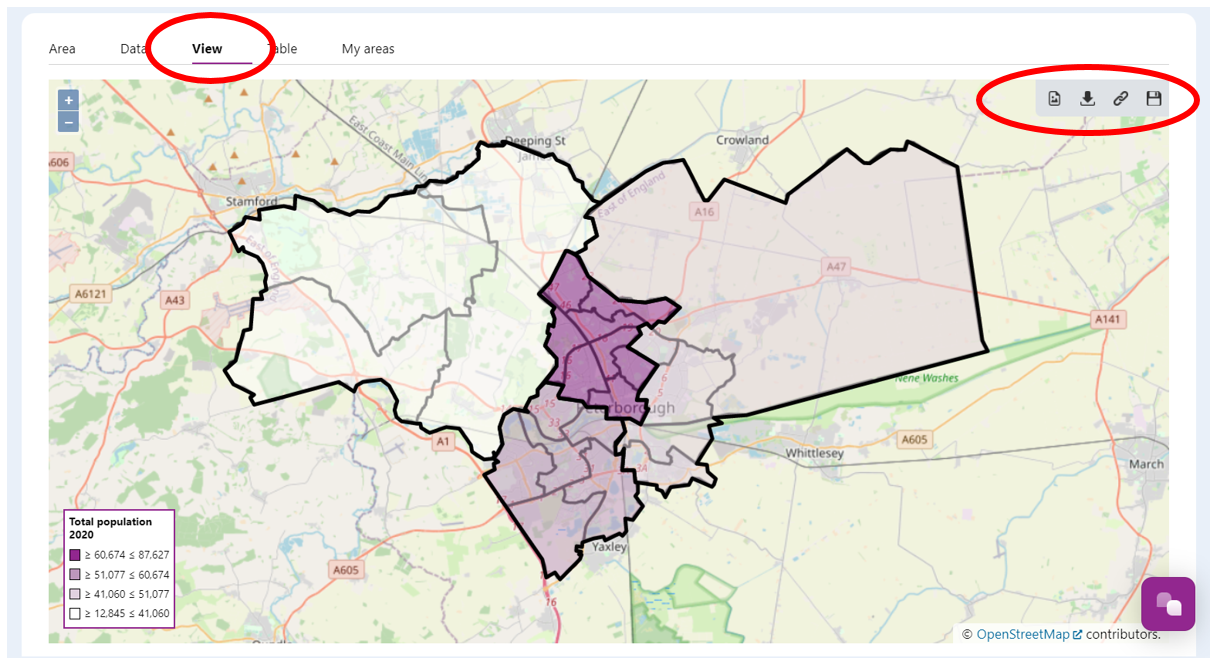
The options are shown below:
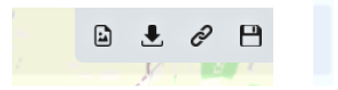
The options are:
- Create and download an image (png) file of the map to your computer
- Download a csv file of the data shown on the map
- See and copy links or embed code to use the map elsewhere
- Save the component (map) as a new LG Inform Plus Report or appended to an existing one.
Back to top
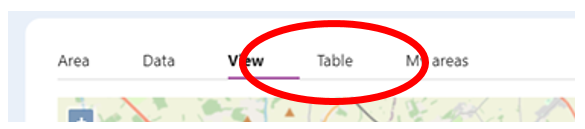
See the data table
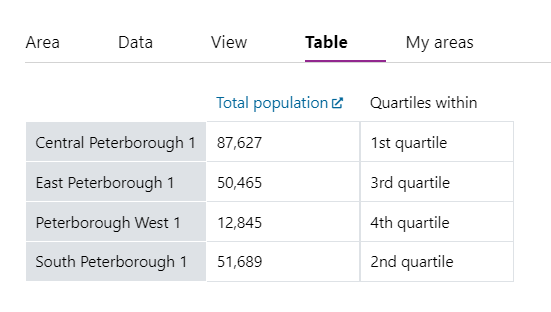
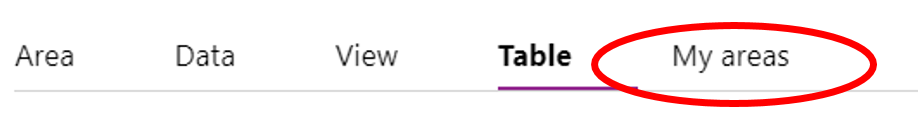
Users can view a table of the data for the metric type chosen via the ‘Table’ tab.
The table shows the data in the areas created together with information on the quartile the area sits within.
By clicking the final tab: ‘My Areas’ users can see the store of all their areas created so far.
Back to top
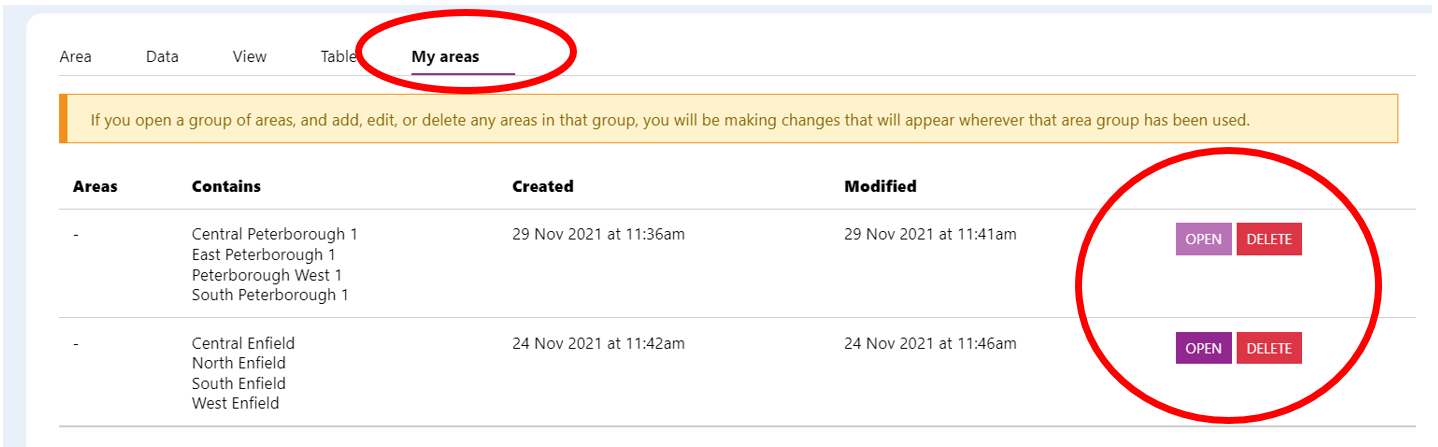
Manage your areas
In ‘My areas’, you can see all the areas that have been created by your organisation in their area groups. They can be opened for editing to view on a map or to view data. If you click on the ‘Open’ button the area group you have chosen is displayed for editing on the ‘Area’ tab.
If any group is no longer required it can be deleted by clicking on the ‘Delete’ button and then confirming that you wish to delete the group in the lightbox displayed.
Back to top
Need more help?
We hope you found this introduction to LG Inform Plus useful, but if you have any further questions or would like to learn more, please get in touch.
Use the Help link in the navigation bar anywhere in LG Inform Plus to read through our online help guides, or send an email to support@lginform.local.gov.uk and the support team will get back to you (Monday – Friday, 9 a.m. to 5.30 p.m.).
Users can use the chat function to get more support. Just click this icon
 Back to top