LG Inform Plus My Local Metrics Help Guide
What is it?
My Local Metrics is a data service allowing LG Inform Plus subscribers to add their local data items, or local performance indicators, to the LG Inform database for use alongside the 13,000+ publicly available data items it already holds.
Using the LG Inform Plus secure platform, you can define new metric types and upload their values for use within the LG Inform, LG Inform Plus and the LGI API tools. Once uploaded, these metrics can be used to create anything from simple charts, tables and maps to complex reports which will better reflect local needs and priorities.
Twenty-four hours after upload, the new data is ready for use. The LG Inform and LG Inform Plus functionality, such as our report writing tools, natural neighbourhoods and the API can be used to surface the data or write detailed reports using your own data alongside a range of values from national sources. Subsequently, by adding new data for future time periods, these reports will automatically update as newer data is added.
You can also choose to share this new local data with other subscribing organisations to promote joint working on strategic initiatives, for example via a Joint Strategic Needs (JSN) Assessment. The My Local Metrics service lets you define exactly which organisations can view the new data on an item by item basis, so you can keep some data items private while sharing others with key partners.
Back to top
Accessing My Local Metrics
To access My Local Metrics your organisation needs to subscribe to the LG Inform Plus service. Subscribing organisations have an automatic allocation of twenty five database spaces ready to store their local metrics with their standard subscription. More database space for additional metrics can easily be added by upgrading your subscription. For further information about My Local Metrics please email: lginformplus@local.gov.uk
Back to top
Using the module
Follow these instructions to add new or view any metrics that have been added by other LG Inform Plus users from your organisation.
1. Go to My Local Metrics
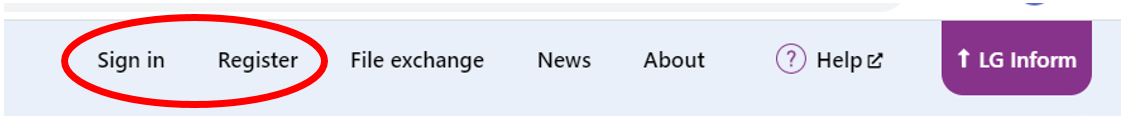
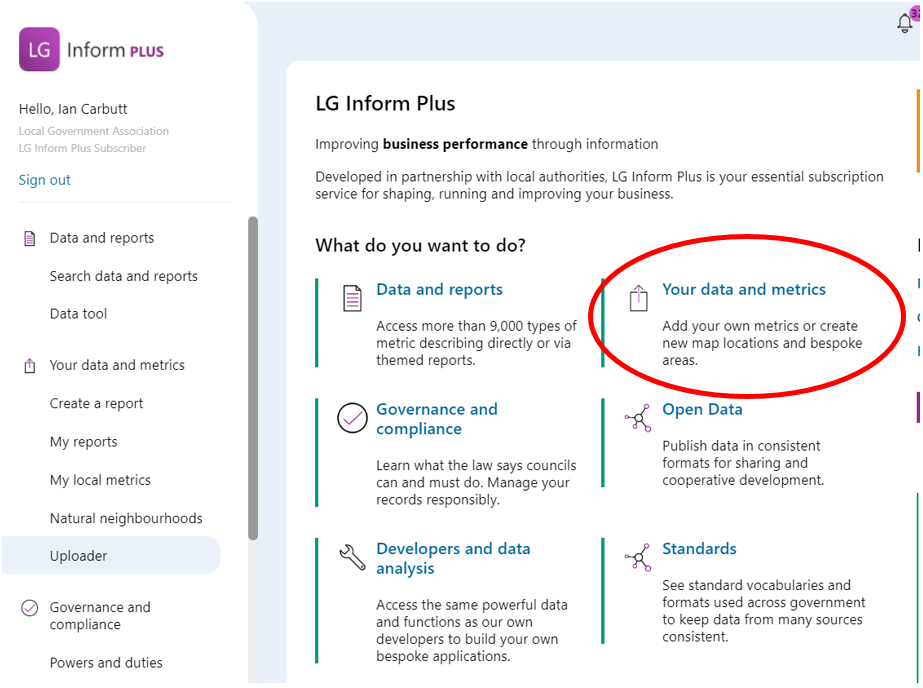
Go to the front page of LG Inform Plus (lginformplus.local.gov.uk) and sign in. Once signed in, click on ‘Your data and metrics’.
If you have not previously registered, use the “Register” option first to register with your council email address.
Your organisation needs to be subscribed to LG Inform Plus to use this tool. If you don’t have access after sign in contact: lginformplus@local.gov.uk or the Support team at: support@lginform.local.gov.uk
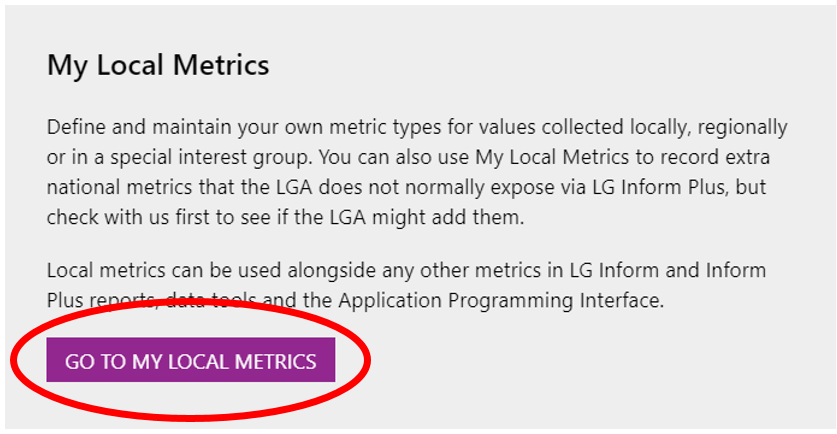
2. Scroll down the page and select ‘Go to my local metrics’
3. View your list of metrics
If your organisation has any metric types defined in the My Local Metrics tool, they will be listed on this page.
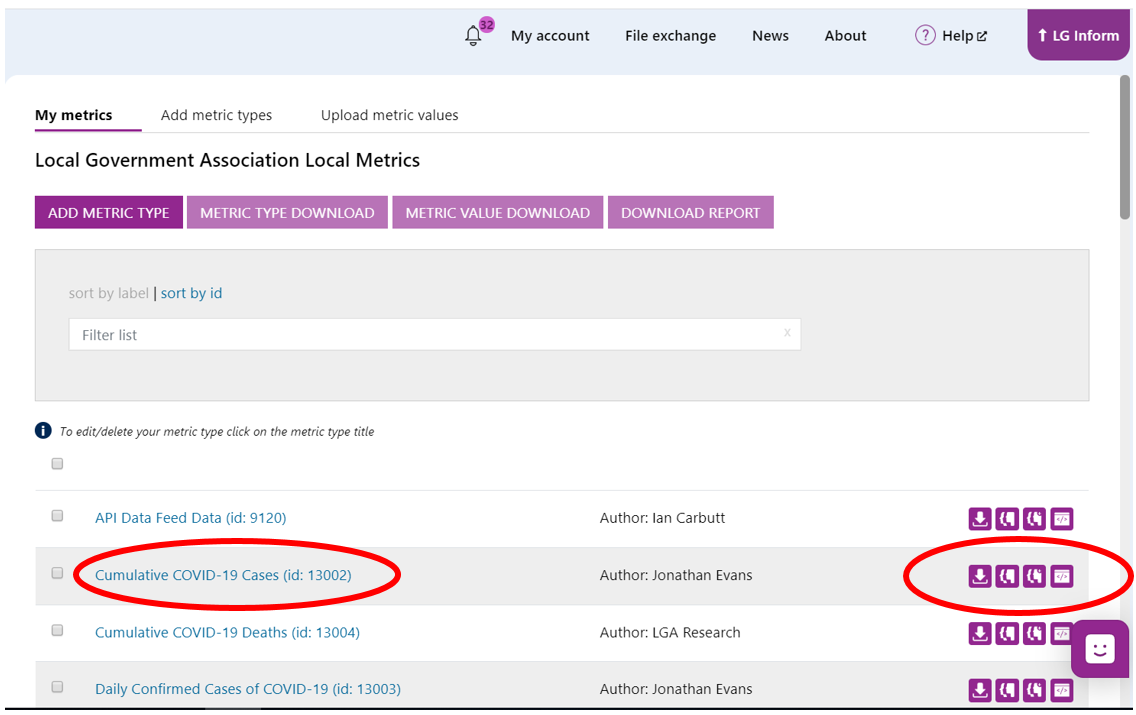
Click on a metric type name to view the details it contains.
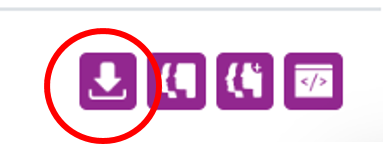
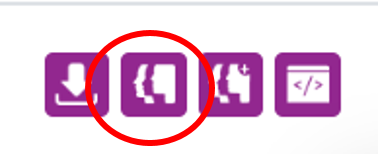
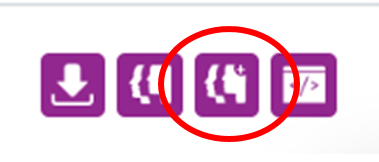
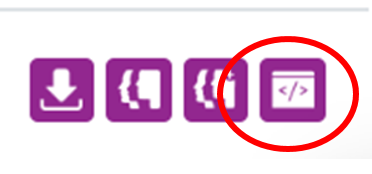
To the right of each metric type name you will see four icons. These are:
- Download data for this metric type
- View an LG Inform report for this metric type
- View an LG Inform Plus report for this metric type
- View this metric type in the LG Inform Plus data tool
Deleting metric types:
To delete any metric check the box to the left of the metric title.
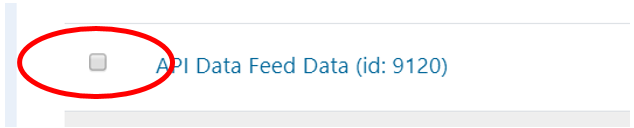
Then open the metric by clicking on the title. Scroll down till you see the delete button.
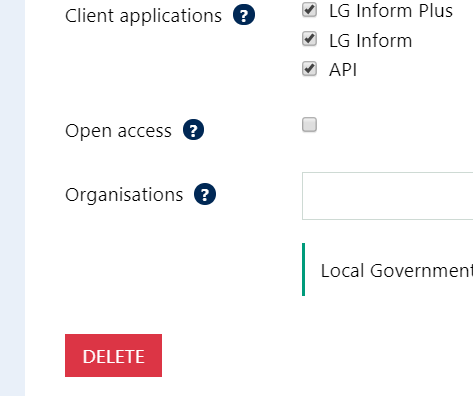
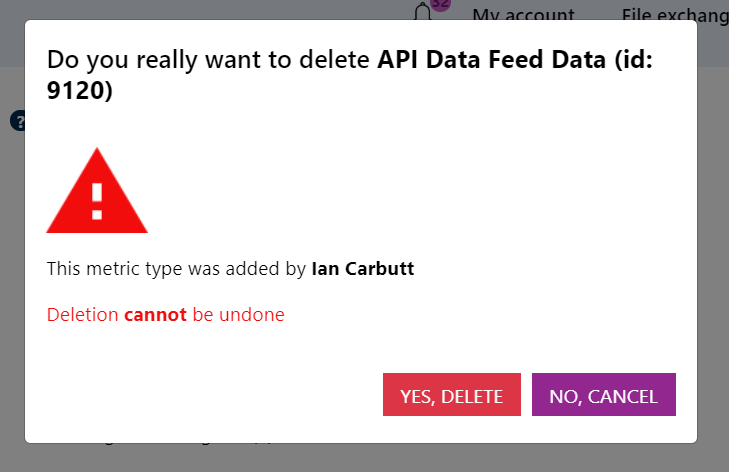
Clicking the delete button will allow you to delete the metric type. Observe the warning message as deletion is permanent so take care!
Downloading data for this metric type:
The download button will produce a comma separated values (CSV) spreadsheet file containing all metric values for the selected metric type.
View an LG Inform report:
LG Inform allows for the benchmarking of data at authority level. When there is no data in LG Inform for this metric type the icon will be grey and not clickable. When there is data in LG Inform for this metric type, the button will become purple and clicking it will take you to a standard report in LG Inform for this metric type.
View an LG Inform Plus report:
LG Inform Plus allows for the benchmarking of data within an authority boundary. When there is no data in LG Inform Plus for this metric type, the icon will be grey and not clickable. When there is data in LG Inform Plus for this metric type, the button will become purple and clicking it will take you to a standard report in LG Inform Plus for this metric type.
View the metric type in the LG Inform Plus data tool:
The LG Inform Plus data tool allows subscribers to interrogate the LG Inform database and pull out the data in CSV format. When there is no data in the LG Inform Plus data tool for this metric type, the icon will be grey and not clickable. When there is data in LG Inform Plus for this metric type, the button will become purple and clicking it will take you to the data tool, allowing you to easily see all the data available.
NOTE: It takes 24 hours for new data uploaded to the system to become available across all tools, so if you are expecting this link to be active and it is not, please ensure you have allowed 24 hours for data to transfer.
Back to top
Create a single metric type
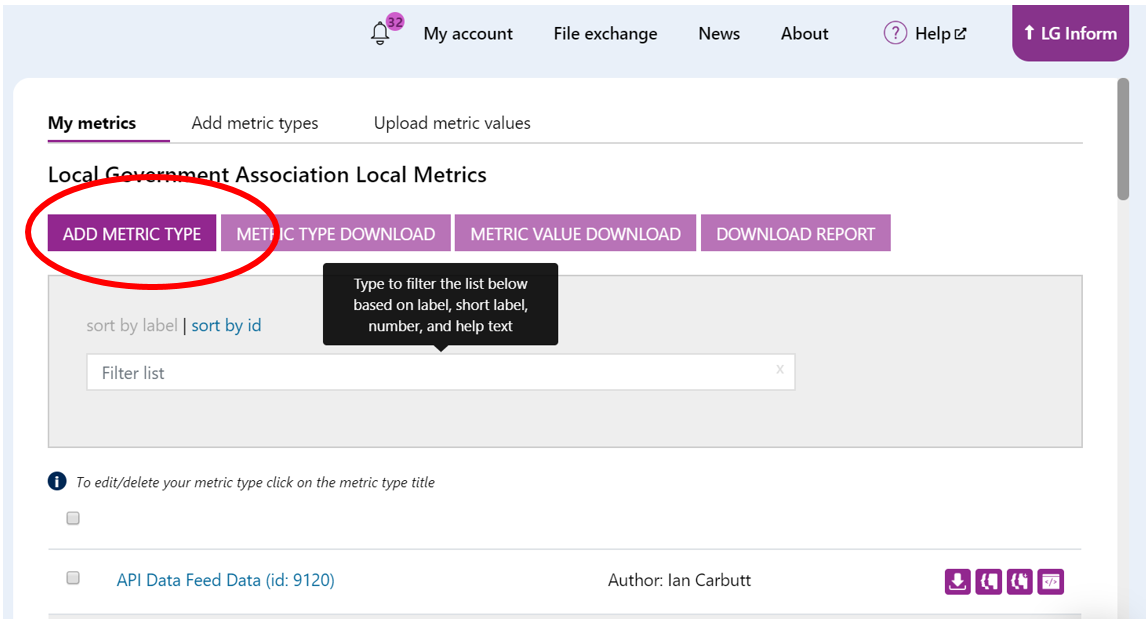
From the “My metrics” tab
To add a new metric, click on the purple “add metric type” button
OR
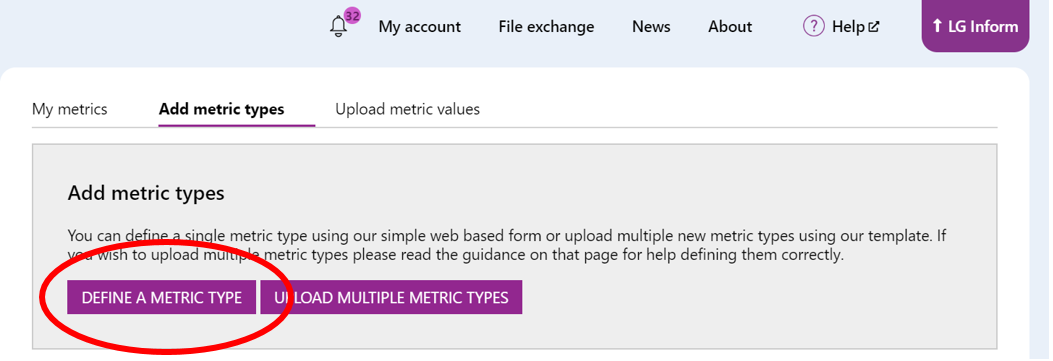
From the “Add metric types” tab to the right of My metrics’
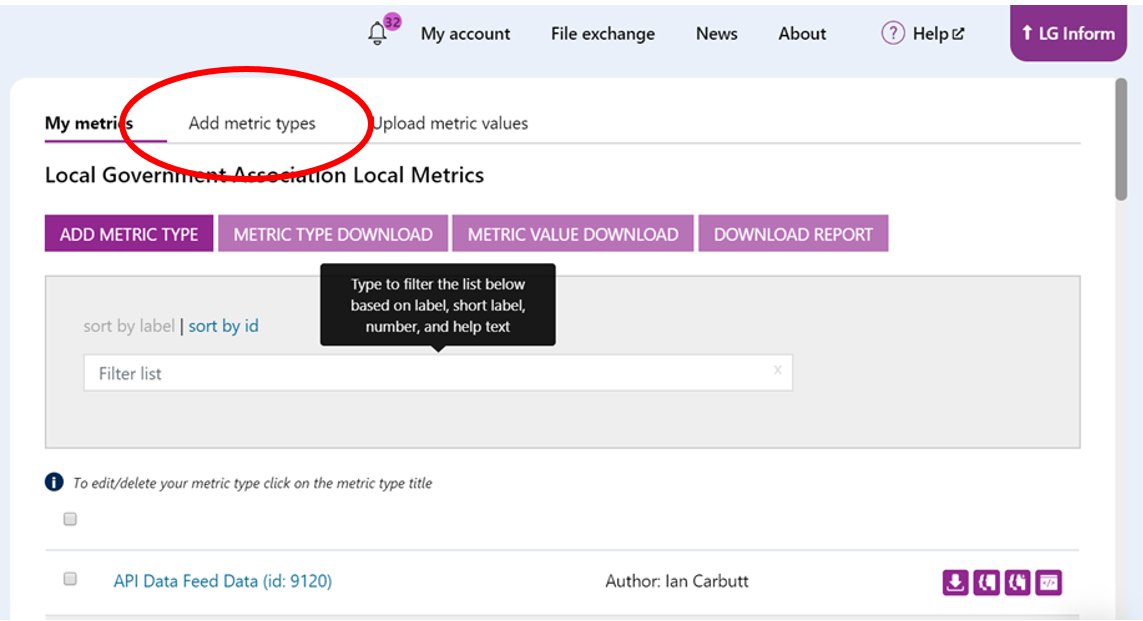
Then click on the purple “Define a metric type” button
1. Fill in the “Create metric type” form
The form will guide you through the process of adding a single metric type. The small “?” icons next to each label contain some hover-over help text.
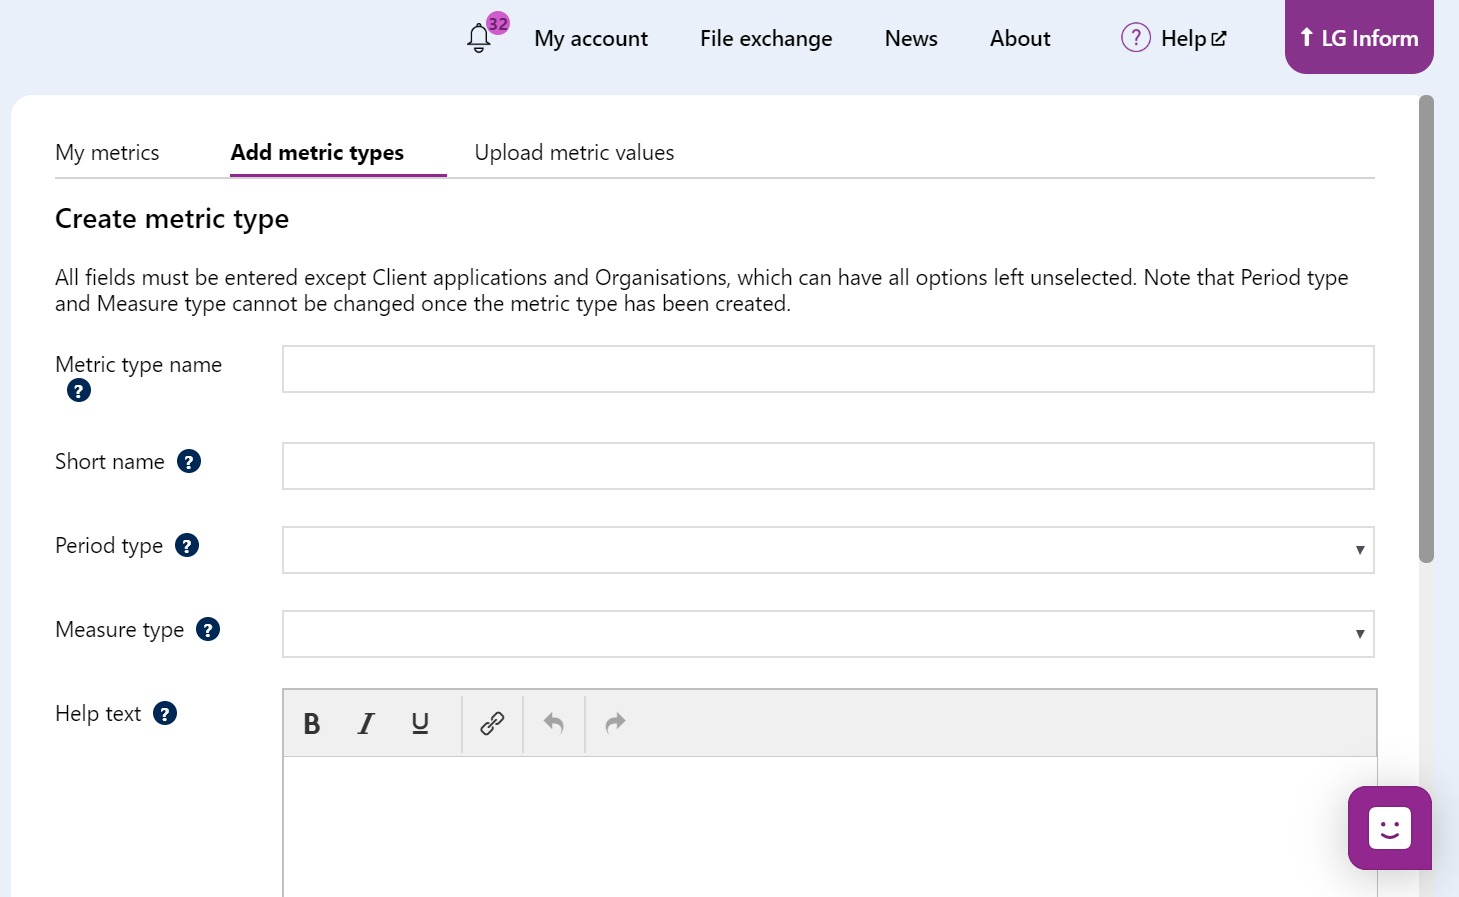
If you need to ‘Chat’ with us at any stage click on this icon.

The following table explains the fields that you need to complete to create your new metric:
|
Metric type name |
The name the metric type will be known by |
|
Short name |
The name the metric type will be known by in places where space is limited. For example, on a chart. |
|
Period type |
The type of time period of the data chosen from the drop down options. For example, if your data covers a calendar year, choose “calendar year”. |
|
Measure type |
What the data value represents chosen from the available drop down options. For example it could be a count or a percentage. |
|
Help text |
The description of the metric type |
|
Polarity |
Whether high values are good {e.g. number of GCSE’s) or low values are good (e.g. number of crimes) or ‘not applicable’ |
|
Client applications |
The LG Inform and LG Inform Plus tools that your metric types will be available in |
|
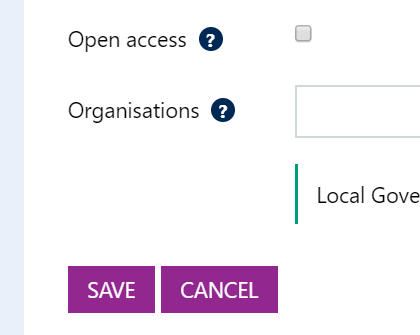
Open access |
Check this to make data for your metric type public access |
|
Organisations |
The organisations that will be able to view the data you add. By default it is limited to just your organisation. |
Period type can be one of these types:
- Academic year
- Calendar quarter
- Calendar year
- Census year
- Financial quarter
- Financial year
- Month
Measure type can be one of these types:
- Percent (%)
- Count
- GBP
- Incidents
- Mean
- Other
- Ratio
- Score
2. Save your metric type
Click the “Save” button and, assuming that you have correctly filled out the form, you will be notified that it has been saved and asked if you would like to add another metric or start adding data. Otherwise an error message will be shown. The "Cancel" button halts the process.
Back to top
Upload multiple metric types
If you need to add multiple new metric types, you can do this with the spreadsheet upload. Your spreadsheet will need to be formatted in a specific way so we have provided a template for you to use.
1. Download the template
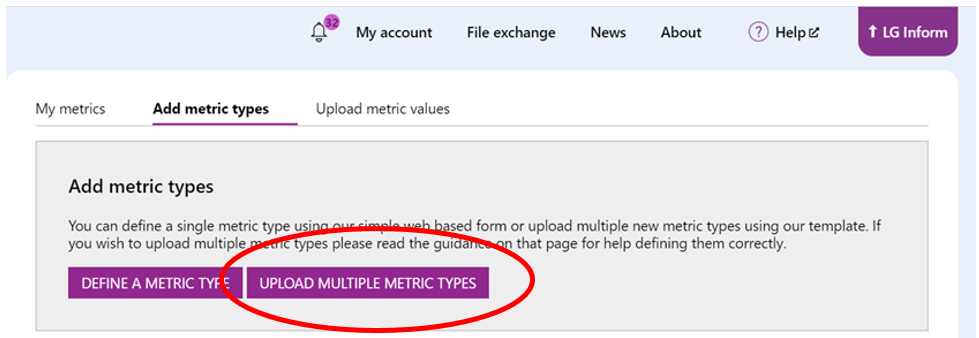
Visit the “Add metric types” tab and then click the purple “upload multiple metric types” button.
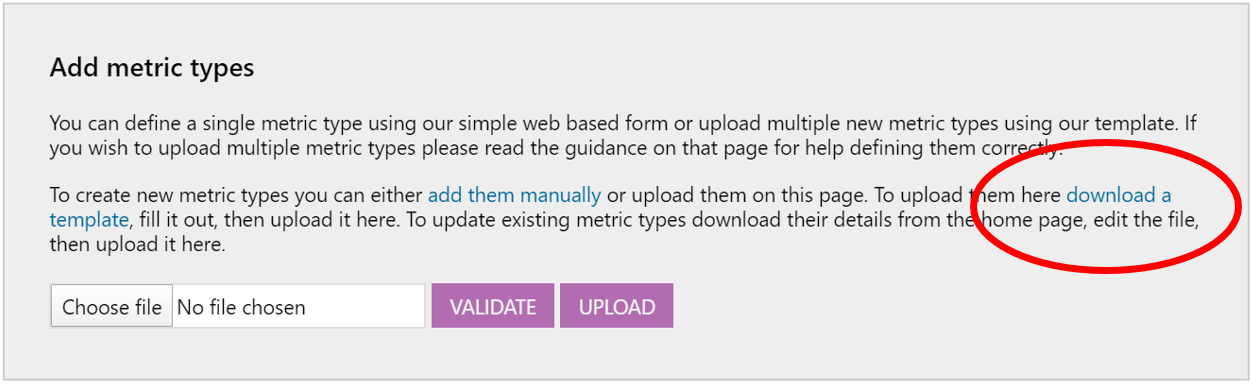
Click the “download template” link and a CSV file will download to your computer.
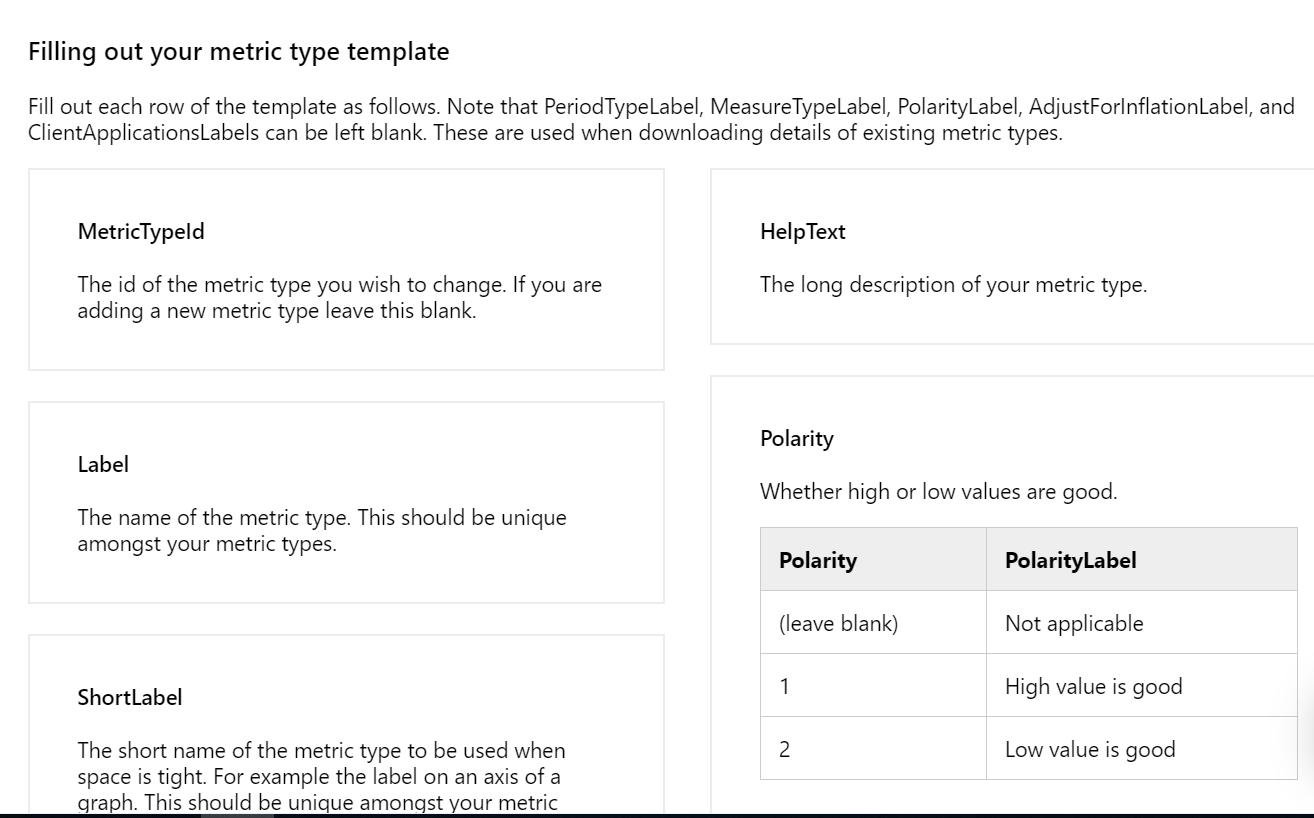
2. Populating the template
Open the CSV file here
and then populate the columns with the following values:
|
MetricTypeId |
The ID of the metric type you wish to change. Do not edit this. If you are adding a new metric type leave this blank. |
||||||||||||||
|
Label |
The name of the metric type. This should be unique amongst your metric types. |
||||||||||||||
|
ShortLabel |
The short name of the metric type to be used when space is tight. For example the label on an axis of a graph. This should be unique amongst your metric types. |
||||||||||||||
|
PeriodType |
The frequency with which the data is collected. This cannot be changed for existing metric types.
|
||||||||||||||
|
MeasureType |
The type of data the value refers to. This cannot be changed for existing metric types.
|
||||||||||||||
|
HelpText |
The long description of your metric type |
||||||||||||||
|
Polarity |
Whether high or low values are good or if polarity is ‘not applicable’ |
||||||||||||||
|
AdjustForInflation |
Whether to automatically adjust values according to inflation. Only applicable if measure is GBP. When not GBP use 0. |
||||||||||||||
|
ClientApplications |
Which applications your metric type will be visible on. Pipe delimited, so to select all use esdToolkit|Inform|API |
||||||||||||||
|
Organisations |
The pipe delimited domain name of email addresses in the organisation. For example, if you want to include two organisations, one with addresses user.name@example.com and the other user.name@example.co.uk use example.com|example.co.uk |
Note that the columns for PeriodTypeLabel, MeasureTypeLabel, PolarityLabel, AdjustForInflationLabel, and ClientApplicationsLabels can be left blank. These are used when downloading details of existing metric types.
Once you have populated your CSV spreadsheet with your data, return to the “Add metric types” page and use the file picker to find your file on the computer.
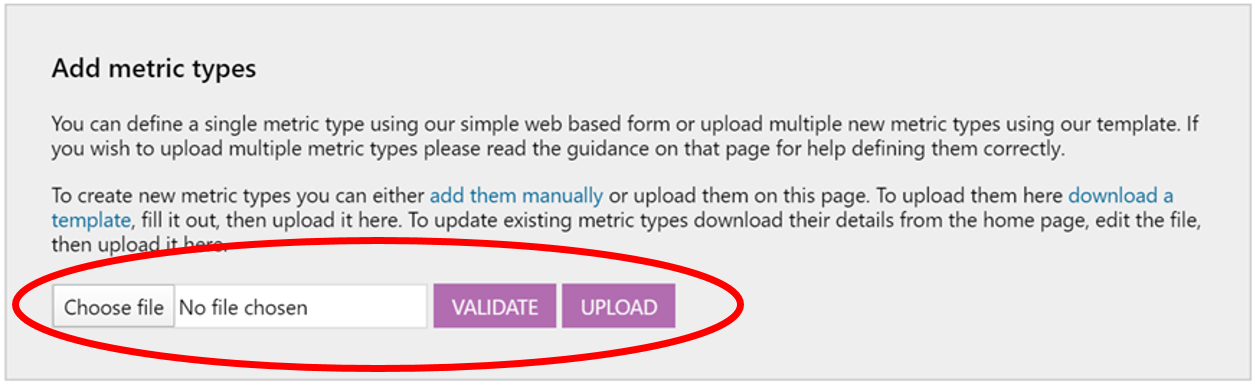
Click the “validate” button and the system will check that your file is valid. If not, it will tell you which cells need editing.
Once the file is validated, click the “upload” button and your metric types will be added.
Please note that while the metric types will be created almost instantly, it will take up to 24 hours for them to appear in all LG Inform/LG Inform Plus tools that you have specified.
Back to top
Upload metric values
Once you have defined some metric types, you will probably want to add values to them. This is done via a spreadsheet upload. Your spreadsheet needs to be in a specific format, so we have provided a template.
1. Download the template
Visit the “Upload metric values” tab.
Use the “Build a template” functionality to create a template. This allows you to say which metric type you wish to add values for, as well as the areas and time periods the data is applicable to.
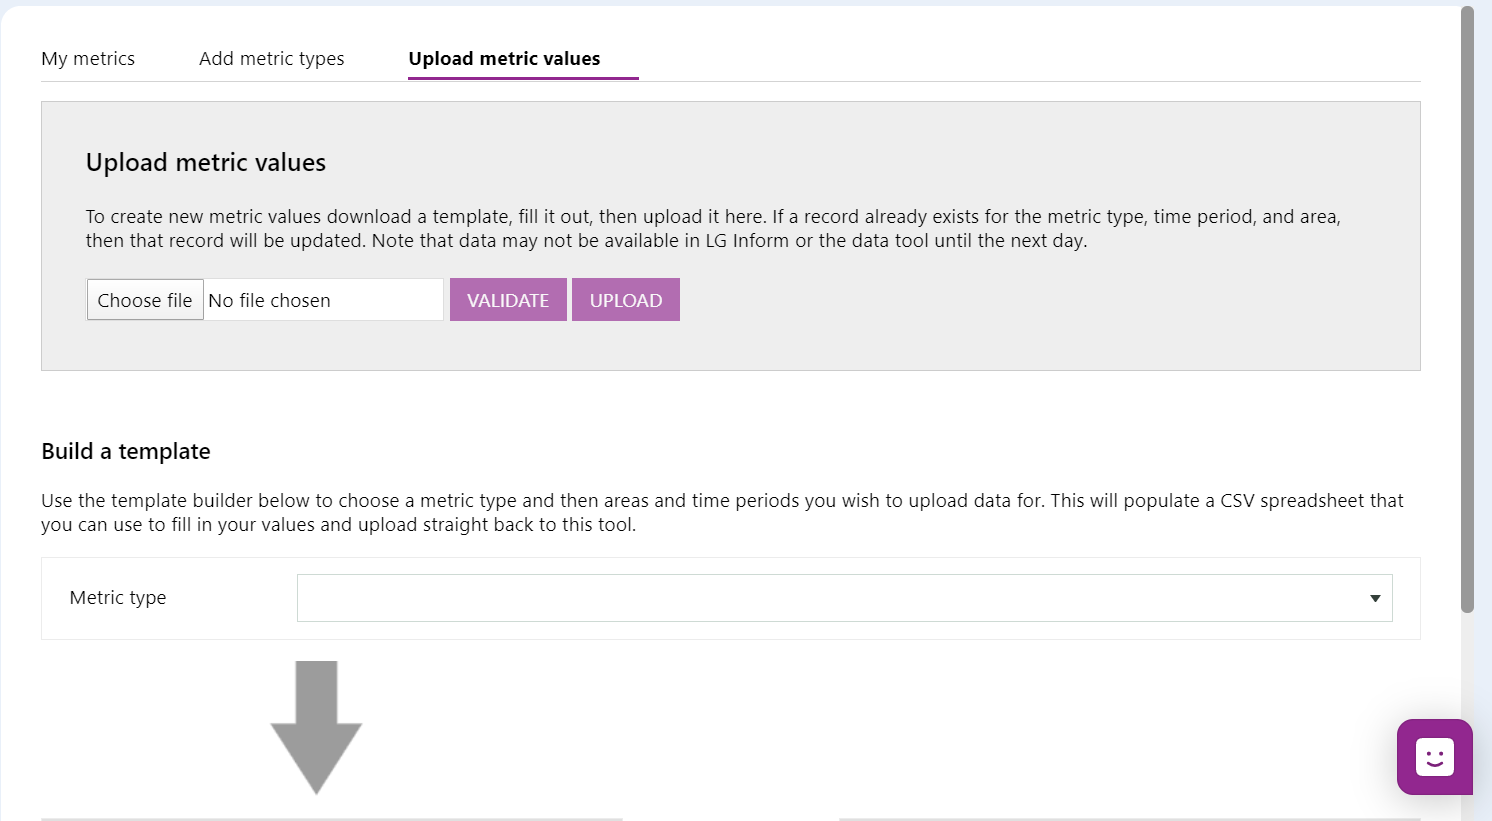
First, pick the metric type you wish to add data for. If you haven’t yet created a metric type, do that first.
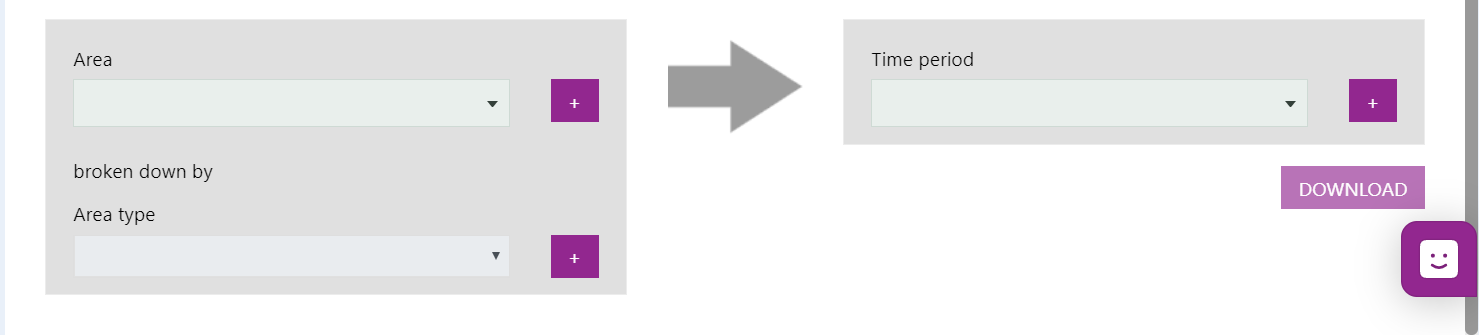
Select the area, and then area type for which you would like to add data. We have preloaded the system with many types of geographies that you can use e.g. all councils, ward boundaries etc.
Select the time period you wish to add data for. Note that by default we will add the most recent time period, but you can remove this if you wish via the red “minus” button to the right of the time period name.
Click the “download” button. The CSV spreadsheet will then download to your computer.
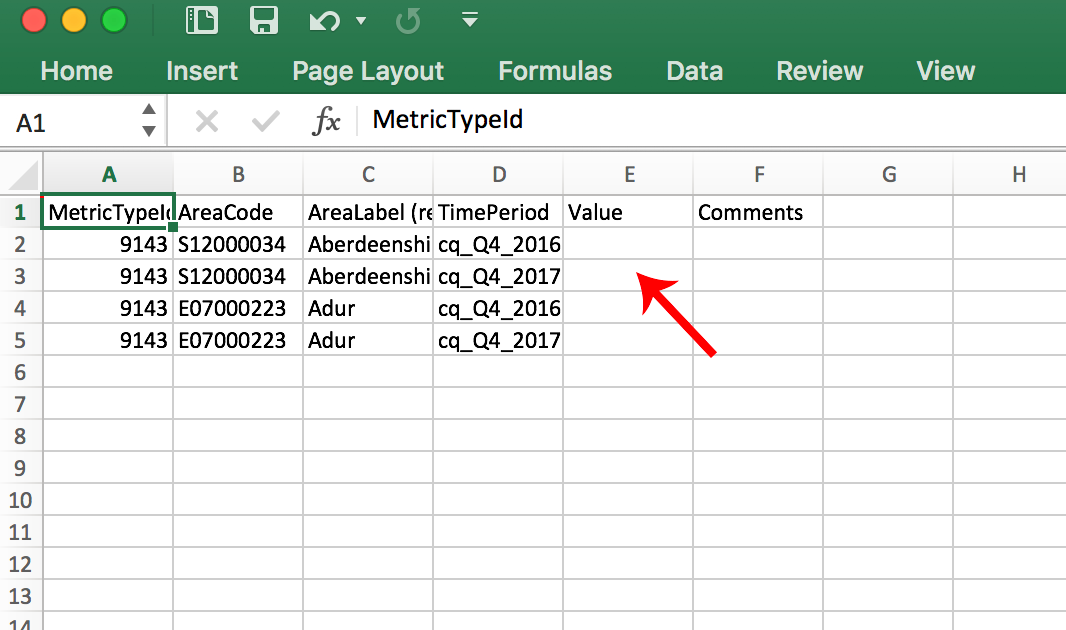
2. Populate the template
Once the template has downloaded you will see a row for each metric type/area/time period combination. If you have picked multiple areas and time periods this could be a long list.
For each row, fill in the “Value” column with the appropriate value. You can also add notes in the “Comments” column if you wish.
When you have finished filling it out, save it to your computer as a CSV file.
3. Upload the spreadsheet
Return to the “Upload metric values” tab and use the file upload picker to select your CSV file from your computer.
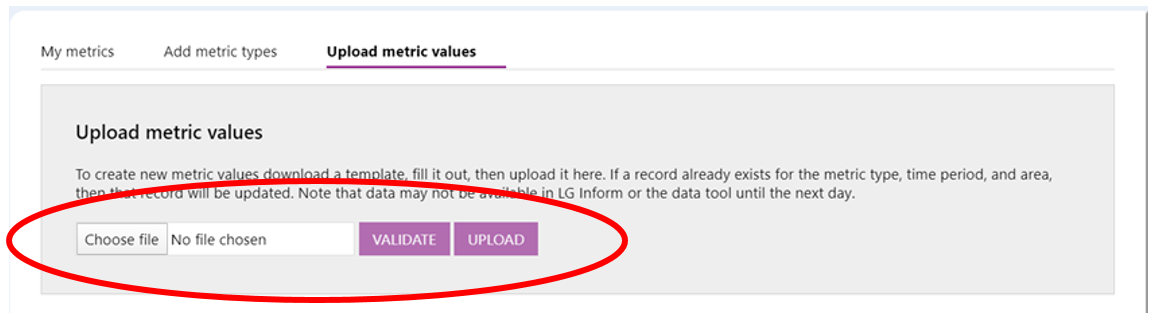
Click the “upload” button. Your upload will be processed in the background. When your upload is complete you will receive an email message with the details of your upload. If there were any errors a message will tell you where they were so that you can fix them.
Back to top
Need more help?
We hope you found the introduction to the “My Local Metrics” tool useful, but if you have any further questions or would like to learn more, use the “Help” link in the navigation bar anywhere in LG Inform Plus to read through our online help guides, or send an email to support@lginform.local.gov.uk and the support team will get back to you (Monday –Friday, 9 a.m. to 5.30 p.m.).
Back to top