If a component is looking squashed due to containing a large amount of data, you can use the 'settings' tab of the component editing interface to change the height in pixels, and the data will then re-adjust to the extra space.
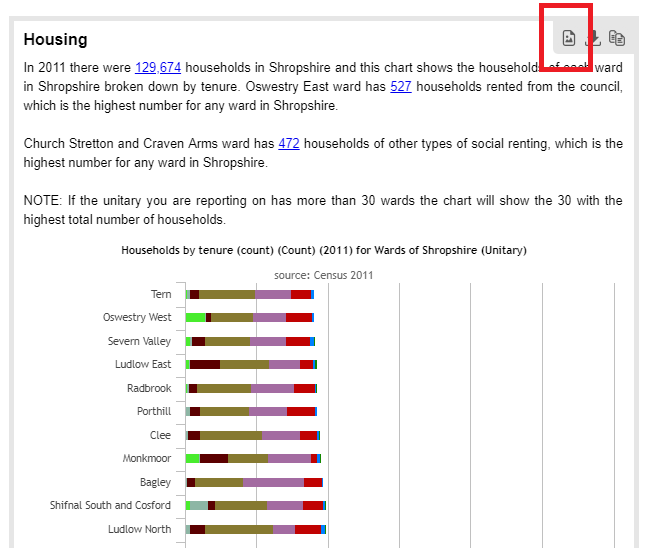
This may cause your component to no longer fit on a single document page in exports - you can also download an image of the chart using the image button (shown below) at the top right of the component.

For bar charts, you can also change the "This chart shows X values from the [top/bottom]" control to change the amount of bars the chart is trying to show, which will also mean it can spread out more across the space allowed.