LG Inform Plus Text Token Editor Help Guide
What is it?
When you want to provide a narrative to the charts, tables and maps in an LG Inform Plus report, you can save time typing out each point manually by using text tokens instead. Text tokens are short strings of code that automatically pull numbers and text straight from the database based on a few simple parameters, and they're incredibly easy to use thanks to the text token editor.
Text tokens ensure that a report is always up to date and can also help when producing reports for neighbouring wards. If you've ever used mail merge on Microsoft Word or have used text tokens before, you'll have a good understanding of how text tokens work.
To access the Text Token Editor your organisation needs to subscribe to the LG Inform Plus service. For further information about subscription please email lginformplus@local.gov.uk
Back to top
What is the Text Token Editor?
The Text Token Editor resides within the LG Inform Plus report builder. You can see it when adding and editing a text component in a report or when editing the text associated with a chart, table or map component.
The report builder is accessed from the LG Inform Plus ‘Home’ page either from the ‘Your data and metrics’ link or via the left-hand side navigation: ‘Create a report’. See below:
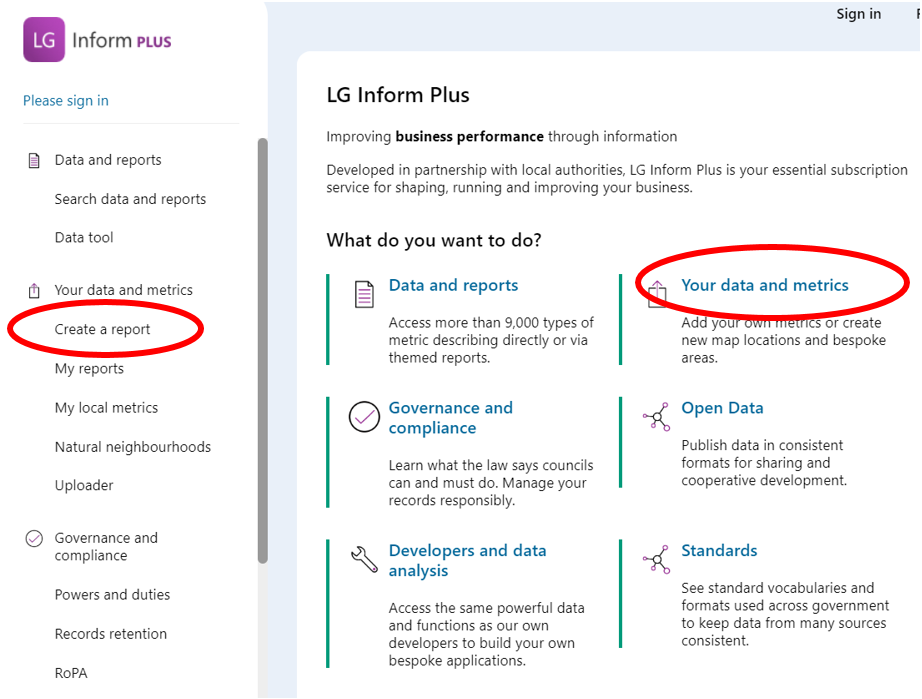
However, remember to ‘Sign-in’ first.
By clicking on the ‘Your data and metrics’ link you will be taken to the ‘Hub’ page shown below: Note the chat icon. Just click it for further assistance.

The ‘Your data and metrics’ hub page is shown below:
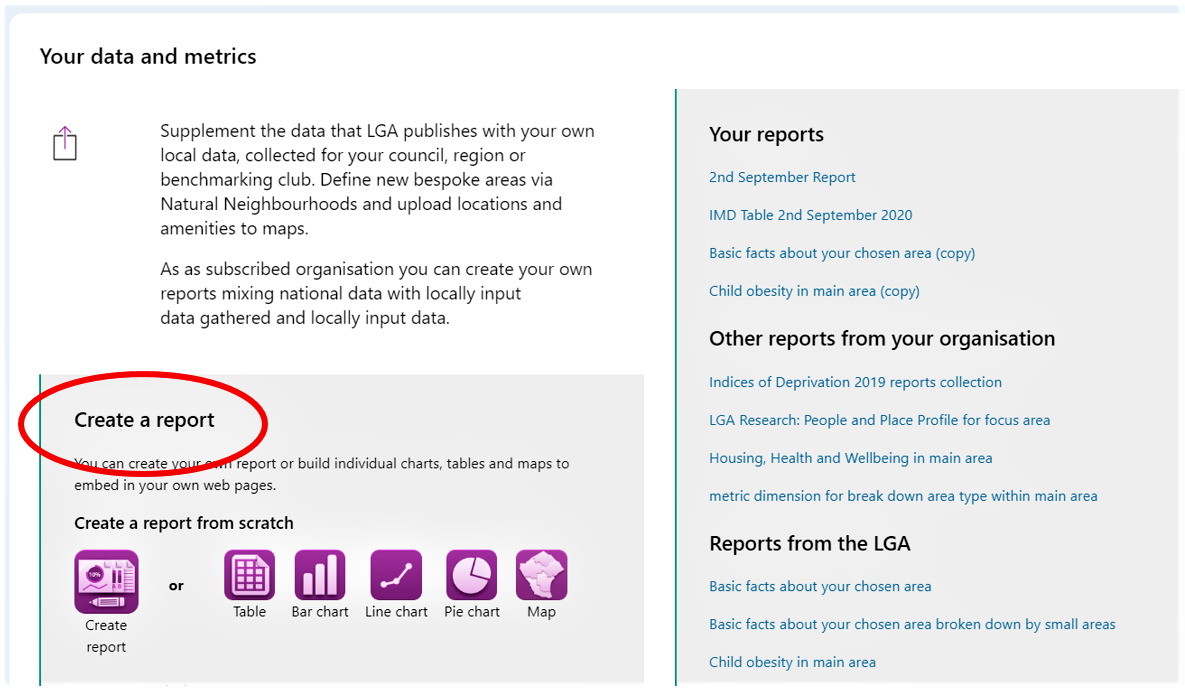
The hub page will show you options to ‘Create a report’ and also show you reports you have recently access or created (Your reports), reports created and shared with you from others (Other reports from your organisation) and Reports from the LGA. You either create your own report from scratch or you can save copies of other people’s reports and edit those copies yourself. See the Report Builder Guide for fuller details on creating reports.
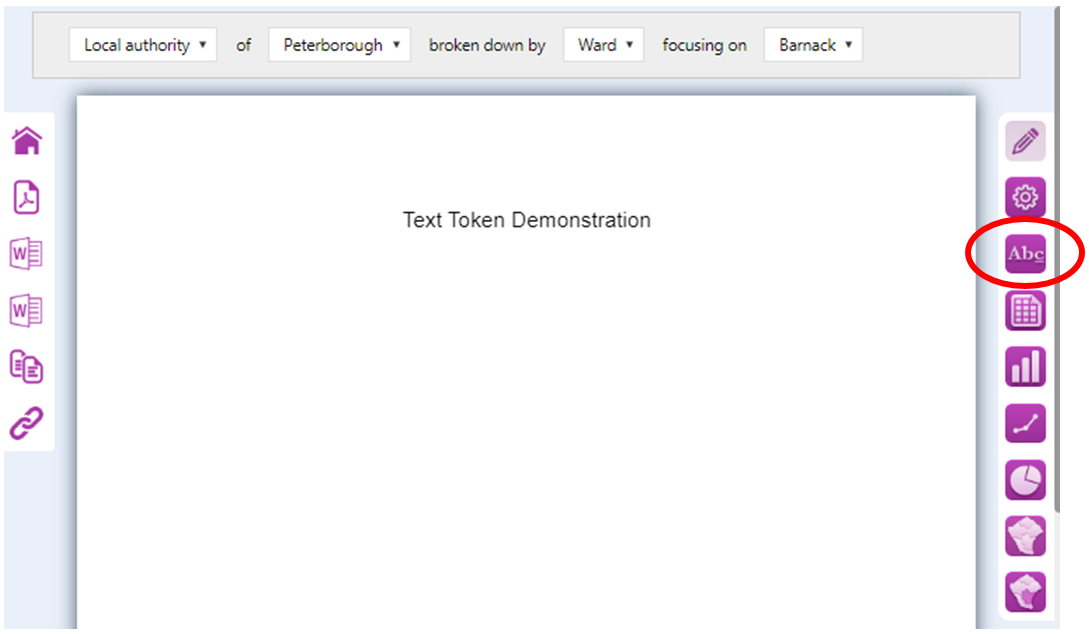
When you have created a new (empty) report, your page will look like this, with your chosen report title at the top. On the right-hand side menu click the ‘Abc’ icon to open up a 'Text Editor' dialogue box.
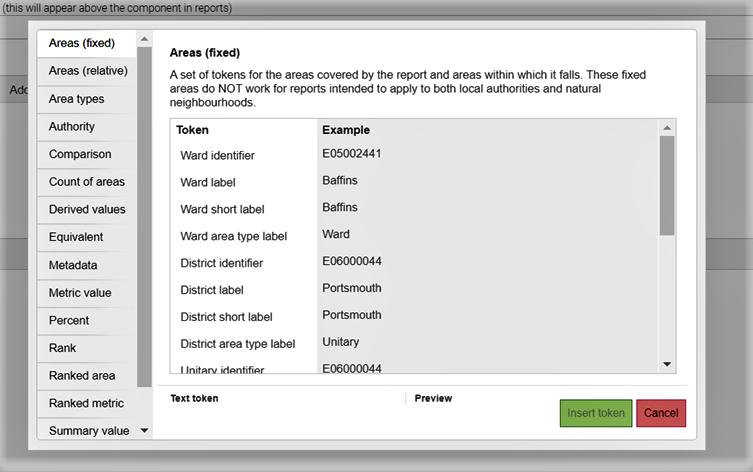
When the Text Editor opens your will see a box in which you can type text, style it and add text tokens via the ‘Add token’ button. The image below shows that page with two sample tokens added.
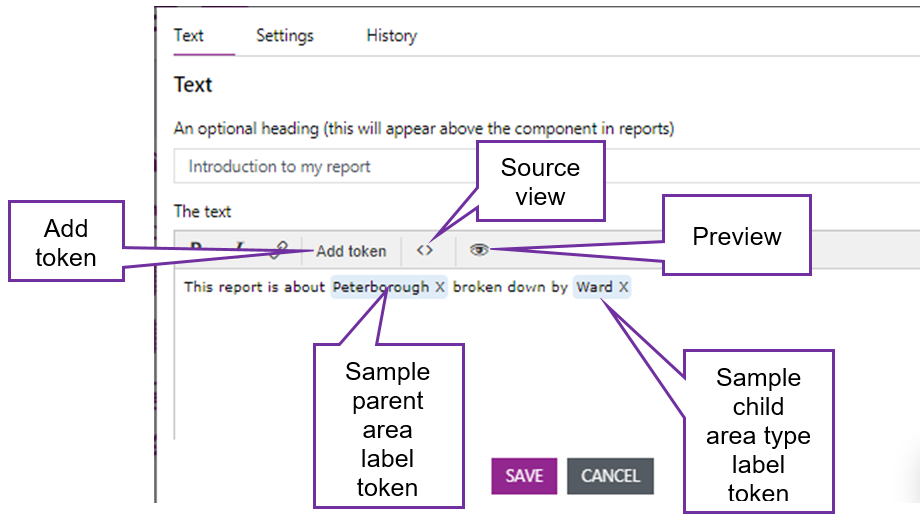
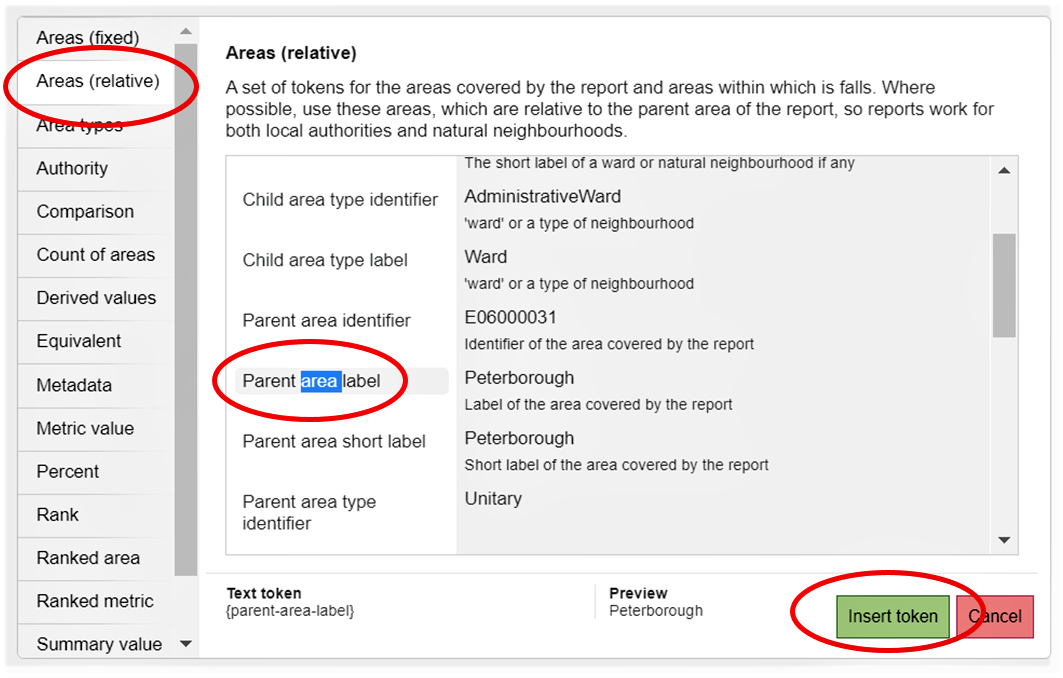
The sample parent area label token is selected from this option in the ‘Add token’ dialogue. In this case it is picked from the ‘Areas (relative)’ tab. Use the ‘Insert token’ button to insert it.
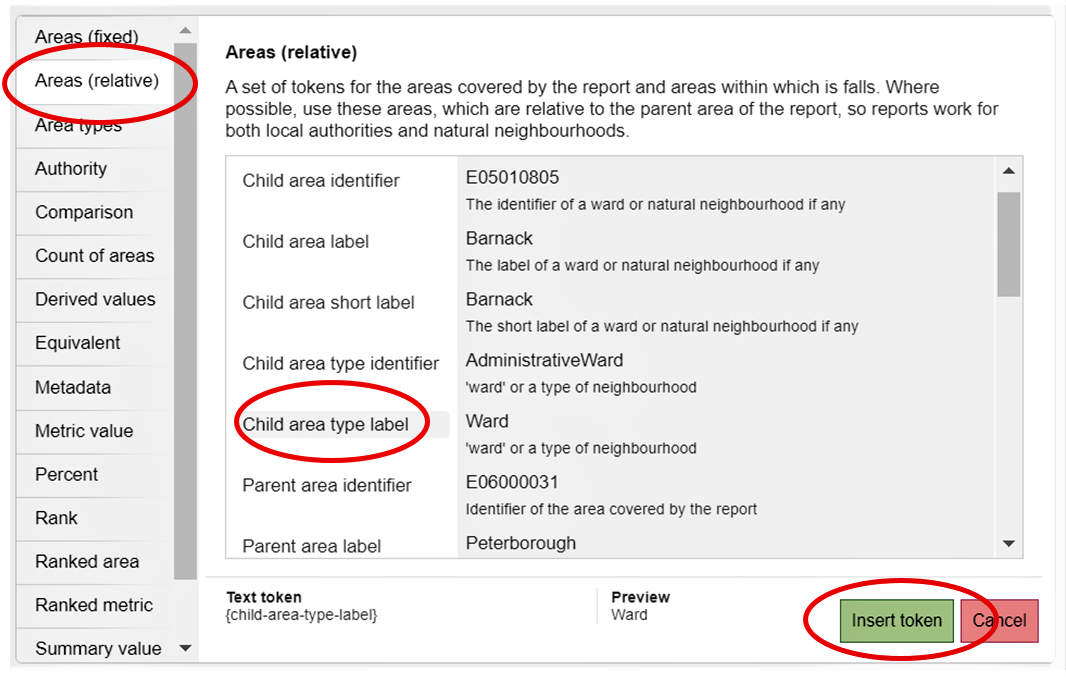
Similarly, the child area type label token is selected from this option in the ‘Add token’ dialogue, picked from the ‘Areas (relative)’ tab. Again use the ‘Insert token’ button to insert it.
You can edit any existing token shown with a blue background in the text by simply clicking on that token.
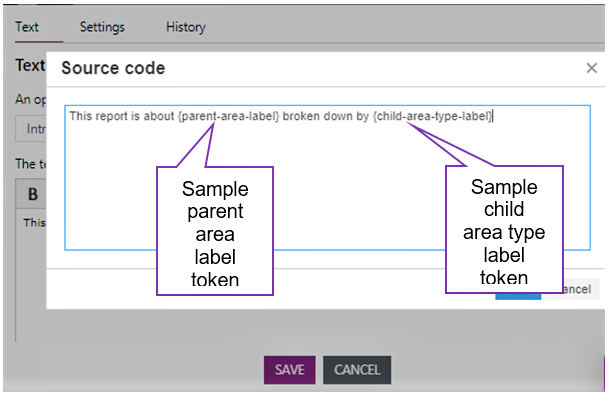
If you select the ‘<>’ source button, you will see a dialogue with the tokens surrounded by braces ({}). When you get more familiar with text tokens you may prefer to add and edit them in this mode and to use it to copy tokens from one text box to another.
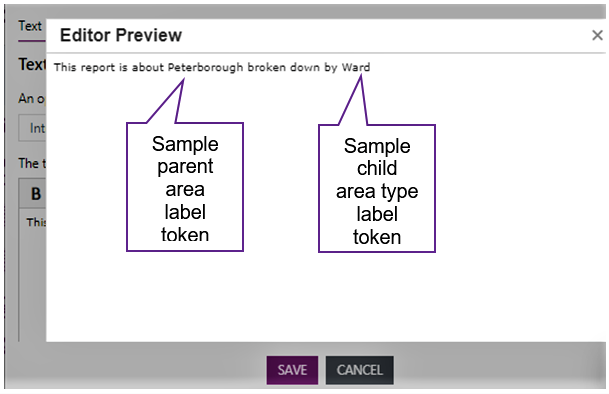
The preview dialogue shows tokens exactly as they appear in your report.
A description of each tab in the ‘Add token’ dialogue is given later in this guide.
Note:
- Use the “Areas (fixed)” tab if you always want your tokens to apply to a specific area type, such as local authority or ward.
- Use the “Areas (relative)” tab if you want your area types to change dependent on a user’s selection. So
- For Peterborough broken down by ward, parent area label is “Peterborough” and child area type label is “Ward”
- For England broken down by local authority, parent area label is “England” and child area type label is “Local authority”
Back to top
Example
Here is an example of how you might use text tokens.
Imagine you want to highlight the number of households where no adult is in employment and where there are no dependent children in your area. You could create a map component, like below, and add some text beneath it to provide a little context and highlight some key points. In this example, we're going to look at the houses within our ward as a percentage of those within the authority for a specified metric:
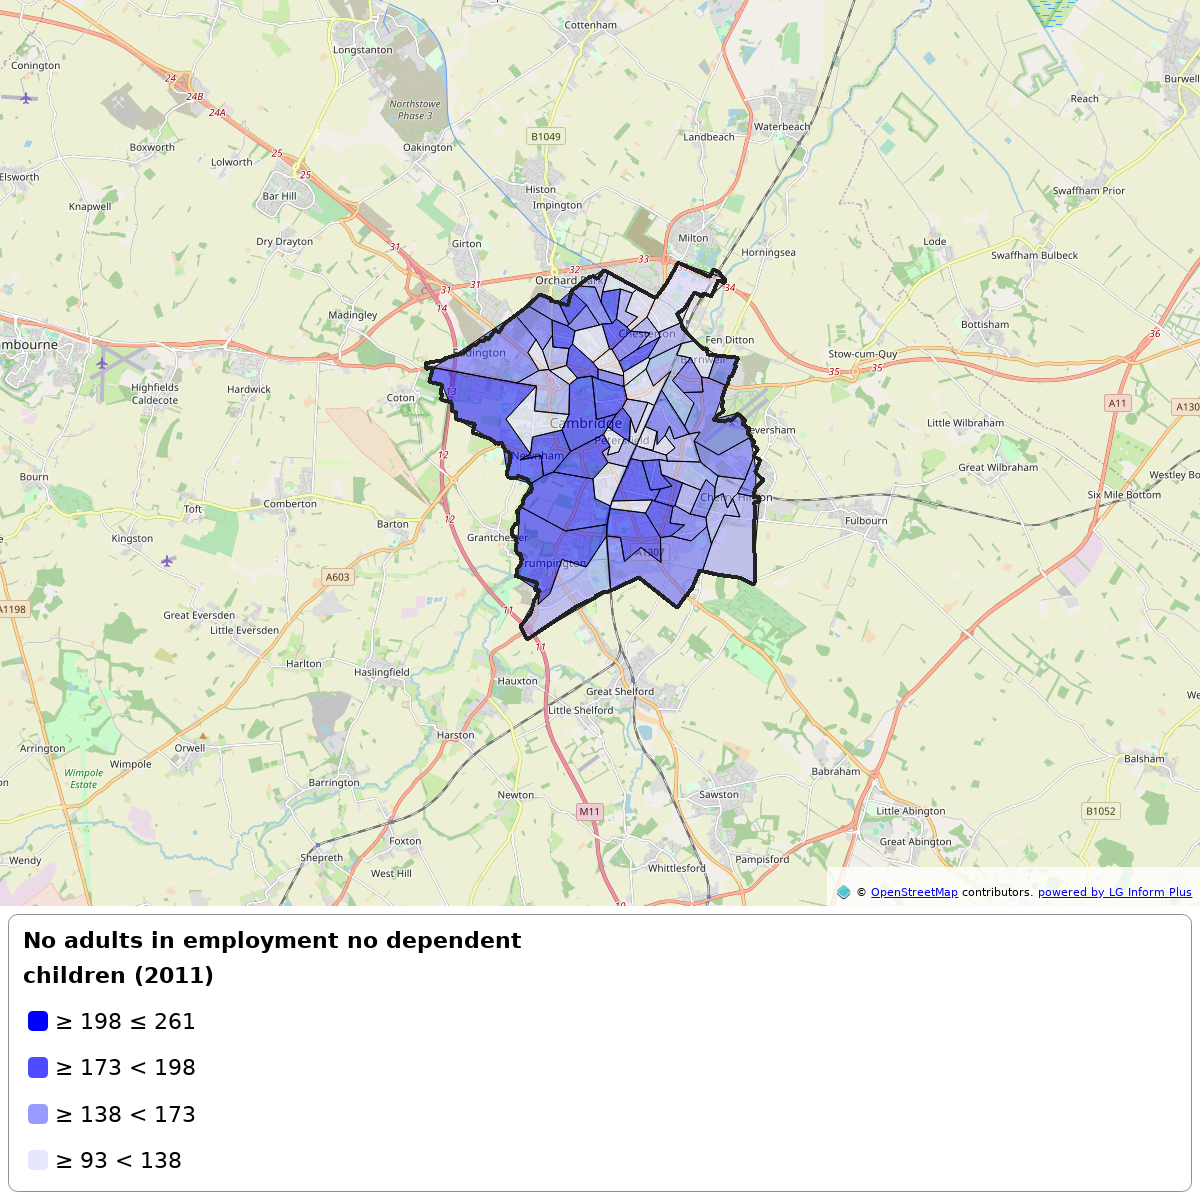
This map shows Number of households where no adult is in employment and where there are no dependent children, taken from census data, for Cambridge 001A within the Cambridge City Council. There are 46,714 houses in the Cambridge City Council, of which 11,821 contain unemployed adults with no dependent children. Cambridge 001A has 207 households containing unemployed adults with no dependent children, which equates to a 1.75% share of all households containing unemployed adults with no dependent children within Cambridge City Council.
Back to top
How text tokens work
Here's the example text again, with the text tokens highlighted in bold.
This map shows Number of households where no adult is in employment and where there are no dependent children, taken from census data, for Cambridge 001A within the Cambridge City Council. There are 46,714 houses in the Cambridge City Council, of which 11,821 contain unemployed adults with no dependent children. Cambridge 001A has 207 households containing unemployed adults with no dependent children, which equates to a 1.75% share of all households containing unemployed adults with no dependent children within Cambridge City Council.
As you can see, the text is populated automatically with all the relevant data and information. When data are updated in the LG Inform Plus database, the values within the report will be updated automatically, which is especially helpful when you need to check the latest figures for a chosen metric. It's also possible to specify the date range for a metric, for example, when you would like to compare current and historic figures. Furthermore, if you change the organisation and ward at the top of this report, you'll see that the data and information in bold changes too, which helps when you need to duplicate a report for a comparison area or neighbouring ward.
Back to top
How to use text tokens
Head back to the help site to find out how to use text tokens.
Each one of the available text tokens is explained in the reference below:
Back to top
Reference
Field tokens are displayed in the following format.
Token Subject
– token object: object description; raw token; output.
If the output line is blank or displays a repeat of the raw token, this suggests that the token is not working/supported.
Function tokens are displayed in the following format.
Token description
Syntax (incl. required & optional parameters)
– parameter: parameter description.
Only functions have parameters but not all are required. Unless an optional parameter is defined, default variables will be displayed – usually a relative child or parent area, figures from the dataset's latest period, or the first-ranked value. Optional parameters are underlined in the syntax line, so these may be omitted if typing tokens by hand rather than using the text token editor.
Areas (fixed)
A set of tokens for the areas covered by the report and areas within which it falls, which can be used to return place names and GSS codes. These fixed areas do not work for reports intended to apply to both local authorities and natural neighbourhoods, so consider using relative areas instead.
Ward
– identifier: the ward's GSS code; { ward-identifier }; E01017975.
– label: the ward's name; { ward-label }; Cambridge 001A.
– short label: the ward's short name (if any); { ward-short-label }; Kings Hedges A.
Unitary/District
– identifier: the unitary's/district's GSS code; { district-identifier }; E07000008.
– label: the unitary's/district's name; { district-label }; Cambridge.
– short label: the unitary's/district's short name (if any); { district-short-label }; Cambridge.
Region
– identifier: the region's GSS code; { region-identifier }; E12000006.
– label: the region's name; { region-label }; East of England.
– short label: the region's short name (if any); { region-short-label }; East of England.
Country
– identifier: the country's GSS code; { country-identifier }; E92000001.
– label: the country's name; { country-label }; England.
– short label: the country's short name (if any); { country-short-label }; England.
Areas (relative)
A set of tokens for the areas covered by the report and areas within which it falls, which can be used to return place names, area types and GSS codes. Where possible, use these areas, which are relative to the parent area of the report, so reports work for both local authorities and natural neighbourhoods.
Child area
- identifier: a ward's or natural neighbourhood's GSS or Natural Neighbourhoods code; {child-area-identifier}; E01017975.
- label: a ward's or natural neighbourhood's name; {child-area-label}; Cambridge 001A.
- short label: a ward's or natural neighbourhood's short name (if any); {child-area-short-label}; Kings Hedges A.
- type identifier: a ward's or natural neighbourhood's type; {child-area-type-identifier}; LLSOA.
- type label: a ward's or natural neighbourhood's report-friendly type; {child-area-type-label}; LSOA.
- type short label: a ward's or natural neighbourhood's type short, report-friendly type; {child-area-type-short-label}; LSOA.
Parent area
- identifier: the GSS code of the area covered by the report; {parent-area-identifier}; E07000008.
- label: the name of the area covered by the report; {parent-area-label}; Cambridge.
- short label: the short name of the area covered by the report; {parent-area-short-label}; Cambridge.
- type identifier: the type of area covered by the report; {parent-area-type-identifier}; District.
- type label: the report-friendly type of area covered by the report; {parent-area-type-label}; District.
- type short label: the short, report-friendly type of area covered by the report; {parent-area-type-short-label}; District.
Ancestor 1 area
- identifier: the GSS code of the first ancestor (e.g. region, county) of the report's parent area; {ancestor-1-identifier}; E10000003.
- label: the name of the first ancestor of the report's parent area; {ancestor-1-label}; Cambridgeshire.
- short label: the short name of the first ancestor of the report's parent area; {ancestor-1-short-label}; Cambridgeshire.
- type identifier: the first ancestor's area type in relation to the report's parent area; {ancestor-1-type-identifier}; County.
- type label: the first ancestor's area type name in relation to the report's parent area; {ancestor-1-type-label}; County.
- type short label: the first ancestor's area type short name in relation to the report's parent area; {ancestor-1-type-short-label}; County.
Ancestor 2 area
- identifier: the GSS code of the second ancestor (e.g. region, county, country) of the report's parent area; {ancestor-2-identifier}; E12000006.
- label: the name of the second ancestor of the report's parent area; {ancestor-2-label}; East of England.
- short label: the short name of the second ancestor of the report's parent area; {ancestor-2-short-label}; East of England.
- type identifier: the second ancestor's area type in relation to the report's parent area; {ancestor-2-type-identifier}; Region.
- type label: the second ancestor's area type name in relation to the report's parent area; {ancestor-2-type-label}; Region.
- type short label: the second ancestor's area type short name in relation to the report's parent area; {ancestor-2-type-short-label}; Region.
Authority
A set of tokens for the local authority described by the report.
Authority
- identifier: the name of the local authority covered by the report; { authority-identifier }; Cambridge City.
- label: the full name of the local authority covered by the report; { authority-label }; Cambridge City Council.
- short label: the short name of the local authority covered by the report; { authority-short-label }; Cambridge City Council.
- area identifier: the GSS code of the local authority covered by the report; { authority-area-identifier }; E07000008.
- area label: the name of the local authority covered by the report; { authority-area-label }; Cambridge.
- area short label: the short name of the local authority covered by the report; { authority-area-short-label }; Cambridge.
- area type identifier: the local authority's area type; { authority-area-type-identifier }; District.
- area type label: a report-friendly version of the local authority's area type; { authority-area-type-label }; District.
- area type short label: a short, report-friendly version of the local authority's area type; { authority-area-type-short-label }; District.
Comparison
Text describing if one value is greater than, equal to or less than another. The text is user-defined meaning that synonyms can be used, e.g. higher, identical, lower, etc. Most useful for comparing means, medians, percentages, etc., rather than absolute values or totals, for example, the percentage of pensioners within a ward that live alone compared to those in the country.
{ =compare?metricType=*&greater=*&equal=*&less=* }
– ?metricType=: the ID number of the metric to check, e.g. 1803
– &area=: the identifier for the area to compare, e.g. { ward-identifier }. The area can be fixed or relative.
– &with=: the identifier for the area to compare against, e.g. { region-identifier }. Cannot compare relative area to fixed area, and vice versa. Use the source code to compare an area's mean value against the mean value for a comparison group.
– &period=: the period of the dataset to check, e.g. cal_2011. If this parameter is omitted, the latest values will be checked by default.
– &withPeriod=: the period of the same dataset to compare, e.g. cal_2010. Use this to compare values for different periods of one metric type.
– &greater=: user-defined text to display when area value is greater than comparison area value, e.g. higher.
– &equal=: user-defined text to display when area value is equal to comparison area value, e.g. the same as.
– &less=: user-defined text to display when area value is less than comparison area value, e.g. less than.
Examples using test metric: Population aged 65 and over (unrounded)
Default comparison for latest period:
less than
less than
Comparison with whole country for latest period:
less than
greater than
Whole country compared with area:
less than
greater than
Count of areas
A count of the area types in a given bounding area. For example, the number of wards within an authority.
{ =countAreas }
– ?area=: the area types to count within a bounding area, e.g. { country-identifier }:{ child-area-type-identifier }. Bounding area precedes area type, separated by a colon.
Examples
Lower level areas within parent area (default):
{ =countAreas }
69
Lower level areas within ancestor area:
{ =countAreas?area={ ancestor-1-identifier }:{ child-area-type-identifier } }
375
Lower level areas within country:
{ =countAreas?area={ ancestor-2-identifier }:{ child-area-type-identifier } }
3614
Areas within ancestor area:
{ =countAreas?area={ ancestor-1-identifier }:{ parent-area-identifier } }
no value
Areas within country:
{ =countAreas?area={ ancestor-2-identifier }:{ parent-area-identifier } }
no value
Regions within country:
{ =countAreas?area={ ancestor-2-identifier }:{ ancestor-1-identifier } }
no value
Derived values
Derived value based on metric type, area and period.
{/=derived?metricType=*&area=*&period=*&valueType=*}
– ?metricType=: the metric type identifier to get the derived values for. One and only one metric type must be specified.
– &area=: a bounding group or comparison group only.
– &period=: the period identifier.
– &valueType=: the valueType to apply to the derived values..
Examples
Default
{/=derived}
{ERROR: Please specify a metric type}
Low birthweight, 5 years in authority
{/=derived?metricType=3306&area=E07000008}Improving
Equivalent
The equivalent value in a chosen area of the predominant circumstance collection in the area covered by the report. For example, if the predominant gender in a lower-level area is male, this token can return the equivalent value for males in the region.
{ =equivalent?metricDimension=* }
– ?metricDimension=: the combination of dataset, dataset measure and circumstance collection from which to collect a value, e.g. [dataset][dataset_measure][circumstance collection].
– &area=: the area covered by the report whose predominant circumstance collection determines the chosen area's value, e.g. { ancestor-1-identifier }.
– &period=: the period for which the dataset covers, e.g. cen_2011.
– &rank=: the ranking of the circumstance collection for which to return an equivalent value, e.g. 1.
– &for=: the area for which the equivalent value should be returned, e.g. { child-area-identifier }.
Examples using test dimension: Residents by age group (%)
Equivalent for parent area (default):
{ =equivalent?metricDimension=[424][424_PercentageofONSpopulationcount][Agestructure] }21.10
Equivalent for child area:
{ =equivalent?metricDimension=[424][424_PercentageofONSpopulationcount][Agestructure]&area={ ancestor-1-identifier }&for={ child-area-identifier } }23.61
Metadata
Details about a selected metric type. Returns the metric type's title (label) by default but can be configured to return a short title, data source, metric collection, a description of the metric type, its polarity rule or the data it was last updated.
{ =metricTypeMetadata?metricType=* }
– ?metricType=: the ID number of the metric type to display metadata for, e.g. 2105.
– &returnValue=: the type of metadata to return. Options: shortLabel; source; collection; helpText; polarity; dataLastUpdated.
Examples using test metric: Number of population male total
Label (default):
{ =metricTypeMetadata?metricType=821 }
Number of population that are male
Short label:
{ =metricTypeMetadata?metricType=821&returnValue=shortLabel }
Male population (count)
Source:
{ =metricTypeMetadata?metricType=821&returnValue=source }
Nomis
Collection:
{ =metricTypeMetadata?metricType=821&returnValue=collection }
mid-year population estimates
Help text:
{ =metricTypeMetadata?metricType=1&returnValue=helpText }
This is the total resident population based on mid year population estimates. The estimated resident population of an area includes all people who usually live there, whatever their nationality. Members of UK and non-UK armed forces stationed in the UK are included and UK forces stationed outside the UK are excluded. This value is provided as rounded to the nearest hundred, unrounded estimates are available https://lginform.local.gov.uk/search?related=3281&op=Search
Polarity:
{ =metricTypeMetadata?metricType=821&returnValue=polarity }
No polarity
Metric value
Returns the value of a metric type for an area and period. Defaults to the latest figures for the ward.
{ =value?metricType=* }
– ?metricType=: the ID number of the metric type from which to return a value, e.g. 92.
– &area=: the fixed or relative area identifier the value represents, e.g. { country-identifier }.
– &period=: the period for which to show data, e.g. cal_2011. Change the digits to specify a year.
– &returnValue=: options: valueWithUnits, displays the units alongside the raw values, e.g. 72%; and periodLabel, displays the date period the data was published.
Examples using test metric: Number of population male total
Main area, latest period (default):
{ =value?metricType=821 }65,200
Parent area, 2012:
{ =value?metricType=821&area=&period=cal_2012 }312,300
Country, 2007:
{ =value?metricType=821&area=&period=cal_2007 }2,775,200
Percent
The value of an area's metric displayed as a percentage of another area's value.
{ =percent?metricType=* }
– ?metricType=: the ID number of the metric type from which to collect values, e.g. 1803.
– &area=: the fixed or relative area identifier for which to return a value (numerator), e.g. { region-identifier }.
– &with=: the fixed or relative area identifier that represents the total count (denominator), e.g. { country-identifier }.
– &period=: the period of the dataset to check, e.g. cen_2011.
Examples using test metric: Number of population female total
Parent area, latest period (default):
{ =percent?metricType=822 }18.61%
Parent area, latest period:
{ =percent?metricType=822&area={ ancestor-1-identifier } }100.00%
Parent area, 2011:
{ =percent?metricType=822&area={ ancestor-1-identifier }&period=cal_2011 }95.73%
Country as percent of parent area, 2011:
{ =percent?metricType=822&area={ ancestor-2-identifier }&with={ parent-area-identifier }&period=cal_2011 }4,913.20%
Rank
The rank of an area within a bounding area for a specified metric type. Defaults to show child area's rank in parent area.
{ =rank?metricType=* }
– ?metricType=: the ID number of the metric type from which to collect values, e.g. 212.
– &period=: the period of the dataset from which to collect values, e.g. cen_2011.
– &within=: the area type to rank within a bounding area, e.g. { country-identifier }:{ child-area-type-identifier }. Bounding area precedes area type, separated by a colon.
Examples using test metric: Population aged 65 and over (unrounded)
Rank of child area within parent area (default):
{ =rank?metricType=3286 }
5
Rank of child area within ancestor:
{ =rank?metricType=3286&within={ ancestor-1-identifier }:{ child-area-type-identifier } }
no value
Rank of child area within country:
{ =rank?metricType=3286&within={ ancestor-2-identifier }:{ child-area-type-identifier } }
no value
Ranked area
The nth ranked area within a bounding area for a specified metric type. Defaults to show child area's rank in parent area.
{ =rankedArea?metricType=* }
– ?metricType=: the ID number of the metric type from which to collect a value, e.g. 125
– &period=: the period of the dataset from which to collect a value, e.g. threeyp_2005_07.
– &rank=: the rank position to return, e.g. 3. Negative numbers can be used to return rank positions from the end of the list, i.e. -1 returns the last, -2 returns the penultimate, etc.
– &returnvalue=: the type of value to return. Defaults to label (name) of nth ranked area. Options: shortLabel; lowerCaseLabel; value; valueWithUnits; percent (of whole dimension).
– &within=: the nth ranked area type within a bounding area, e.g. { country-identifier }:{ child-area-type-identifier }. Bounding area precedes area type, separated by a colon.
Examples using test metric: Population aged 25 to 64 (unrounded)
1st ranked ward within child area (default):
{ =ranked?metricType=3284 }
Cambridge 001F
5th ranked ward within child area:
{ =ranked?metricType=3284&rank=5 }
Cambridge 001F
1st ranked within ancestor:
{ =ranked?metricType=3284&area={ ancestor-1-identifier }:{ child-area-type-identifier } }
East Cambridgeshire 004D
2nd ranked ward within 2nd ancestor:
{ =ranked?metricType=3284&area={ ancestor-2-identifier }:{ child-area-type-identifier }&rank=2 }
Waveney 014A
Ranked metric
The nth ranked label or value of a metric dimension for an area. Most useful for displaying predominant groups. It's easiest to build these tokens using the text token editor.
Metric dimension not recognised
– ?metricDimension=: the combination of dataset, dataset measure and circumstance collection from which to collect a value, e.g. [dataset][dataset_measure][circumstance collection].
– &area=: the area that the label or value represents, e.g. { ward-identifier }.
– &period=: the period of the dataset from which to collect a value, e.g. cen_2011.
– &rank=: the rank position to return, e.g. 4.
Examples using test dimension: Population by age band (working age) (%)
Label of predominant metric type within dimension in this area (default):
{ =rankedMetricType?metricDimension=[545][545_PerCent][Agebandworkingage] }
Proportion of population aged 16 to 64
Value with units of predominant metric type within dimension in this area:
{ =rankedMetricType?metricDimension=[545][545_PerCent][Agebandworkingage]&returnValue=valueWithUnits }
70.2%
Predominant metric within ancestor area:
{ =rankedMetricType?metricDimension=[545][545_PerCent][Agebandworkingage]&area={ ancestor-1-identifier } }
Proportion of population aged 16 to 64
Second ranked metric within country:
{ =rankedMetricType?metricDimension=[545][545_PerCent][Agebandworkingage]&area={ ancestor-2-identifier }&rank=2 }
Proportion of population aged 65 and over (count)
Summary value
The summary value of a metric type for an area type within a bounding area. For example, the mean number of houses in a ward within a chosen region.
{=summary?metricType=*&period=*&summaryType=[band][100][10]&area=*:*}}
– ?metricType=: the metric from which to collect a value, e.g. 2029.
– &period=: the period of the dataset from which to collect a value, e.g. cen_2011.
– &summaryType=: the type of value to return, e.g. median. Options: min; max; mean; median; percentiles can be returned using [band][*denominator*][*numerator*] – the syntax example above returns the tenth percentile.
Examples using test metric: Population aged under 16 (unrounded)
Latest child total within parent area (default):
{=summary?metricType=3282}
21,361
Minimum within parent area
{=summary?metricType=3282&summaryType=min}
115
Median within parent area
{=summary?metricType=3282&summaryType=median}
289
Back to top
Need more help?
We hope you found the introduction to the Text Token Editor useful, but if you have any further questions or would like to learn more, please get in touch.
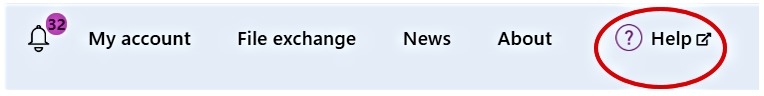
Use the Help link in the navigation bar anywhere in LG Inform Plus to read through our online help guides, or send an email to support@lginform.local.gov.uk and the Support team will get back to you (Mon–Fri, 9 a.m. to 5.30 p.m.).
Back to top