LG Inform Plus Report Builder Help Guide
Report Builder
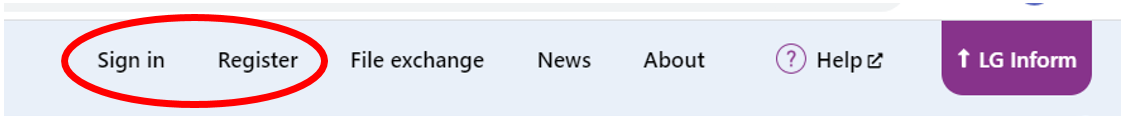
The ability to build reports is only available to organisations who are subscribers to LG Inform Plus and are signed into the site. If you have not registered for an account you can do this using the Register and sign-in options shown below.
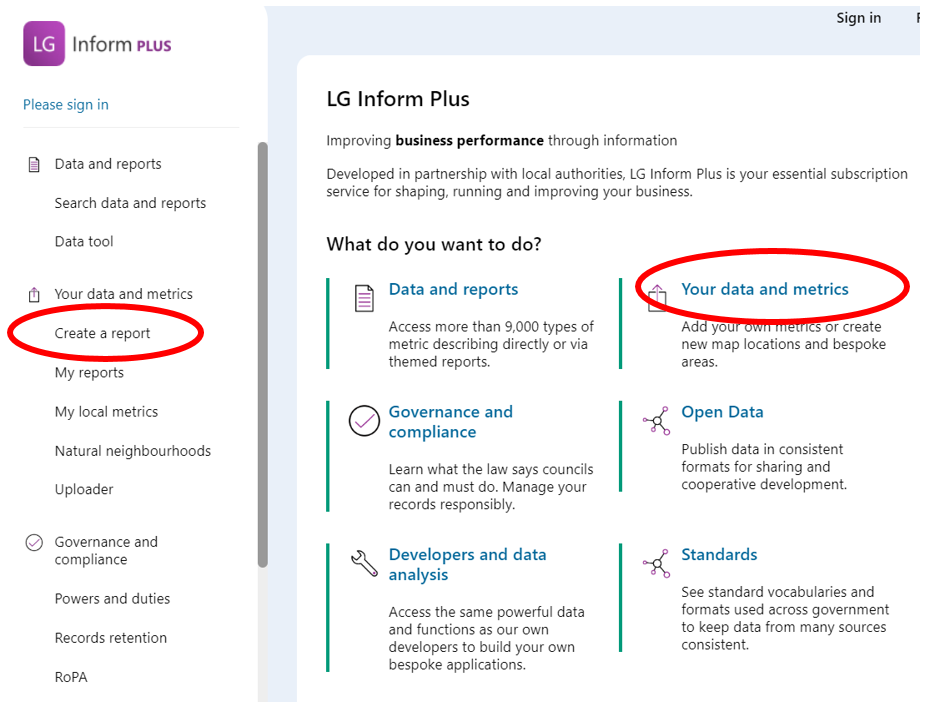
he report builder is accessed from the LG Inform plus ‘Home’ page either from the ‘Your data and metrics’ link or via the left-hand side navigation: ‘Create a report’. See below:
However, remember to ‘Sign-in’ first.
By clicking on the ‘Your data and metrics’ link you will be taken to the ‘Hub’ page shown below: Note the chat icon. Just click it for further assistance.

The ‘Your data and metrics’ hub page is shown below:
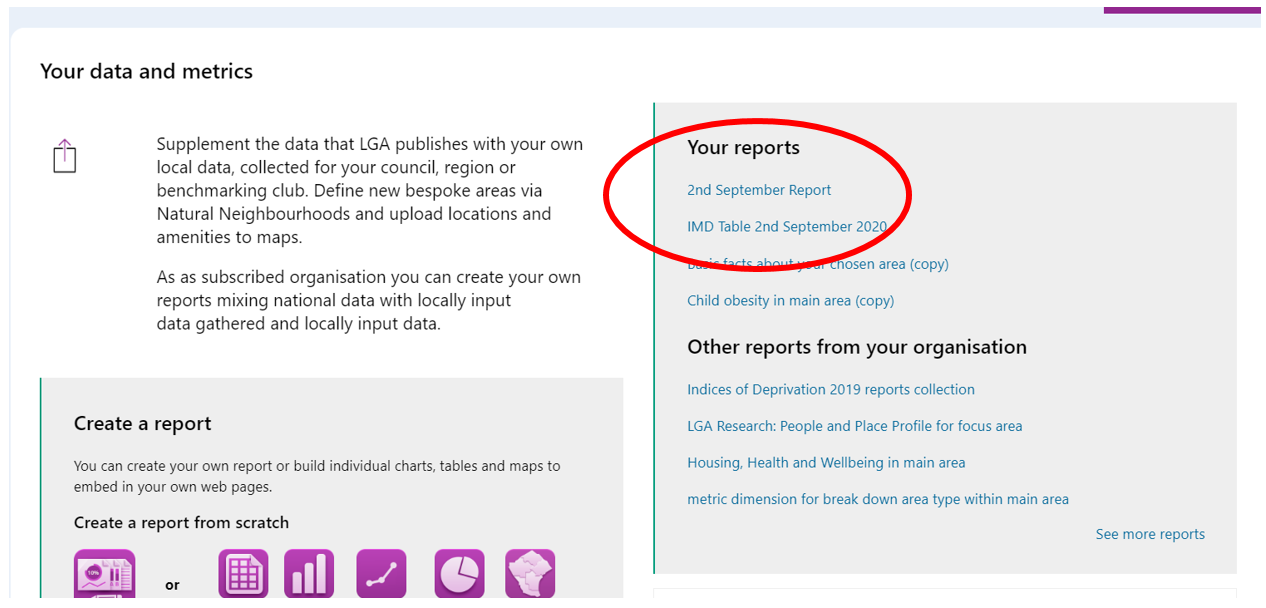
The hub page will show you options to ‘Create a report’ and also show you reports you have recently access or created (Your reports), reports created and shared with you from others (Other reports from your organisation) and Reports from the LGA.
Additionally, links to ‘Natural Neighbourhoods’ and ‘My Local Metrics’ are available should you wish to create new maps and add local data to use within the LG Inform plus platform.
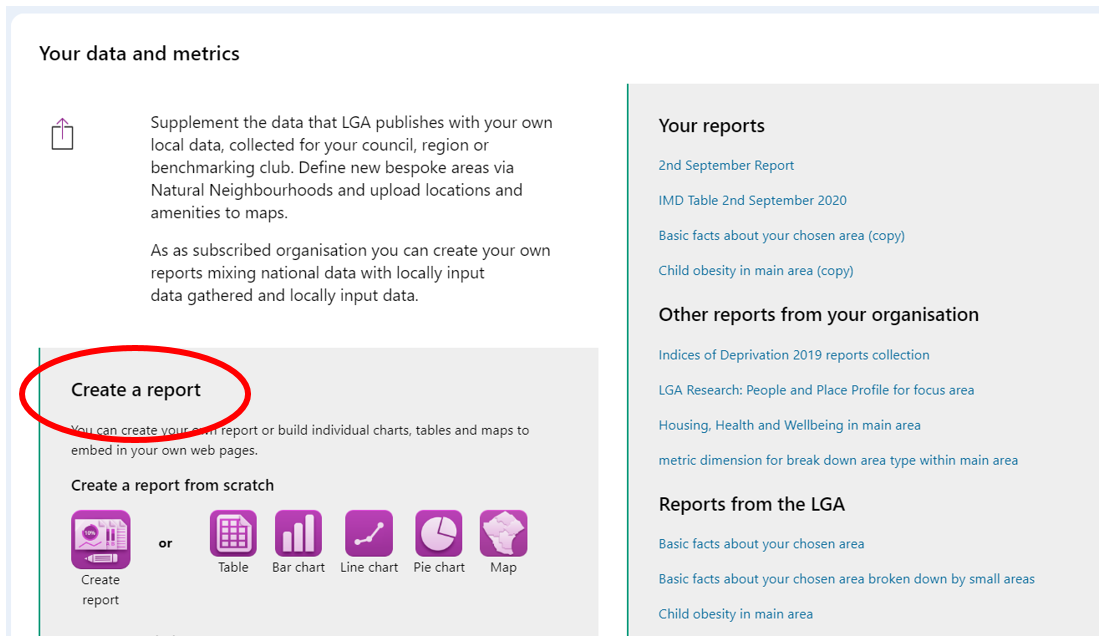
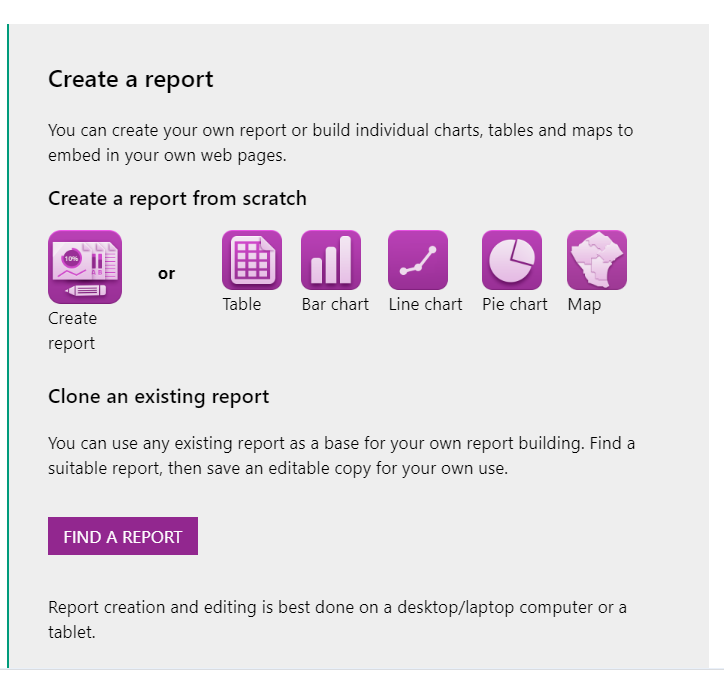
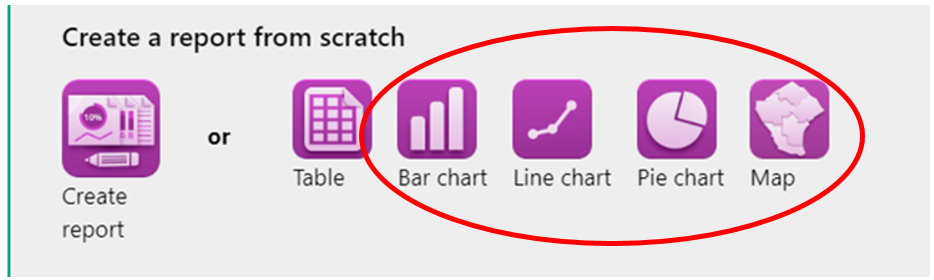
Report building options are available in this ‘tool bar’:
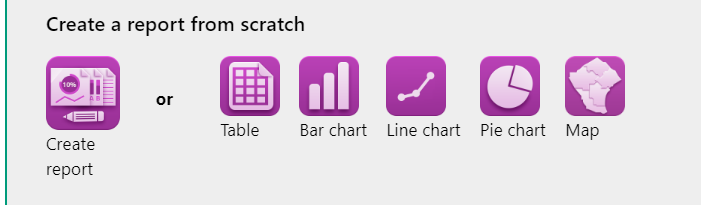
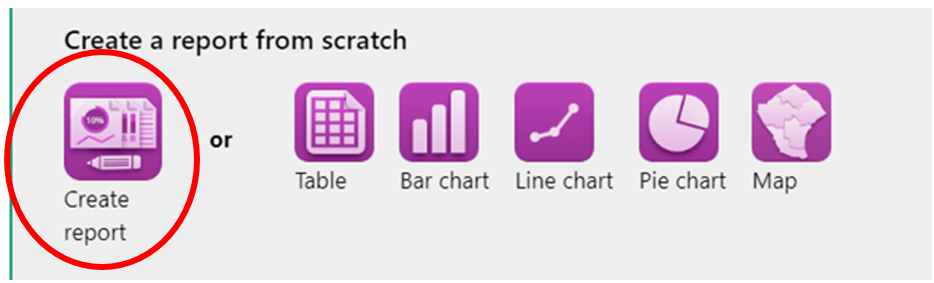
You will see the option to either create a report (which can be made of one or more components) or to create a single component; a table, bar chart, pie chart or map.
Back to top
Creating a component - Table, Bar chart, Line chart, Pie chart or Map
To commence building a new report you can start by building one component to view data for a chosen area. The result can be saved and other components and data added to it.
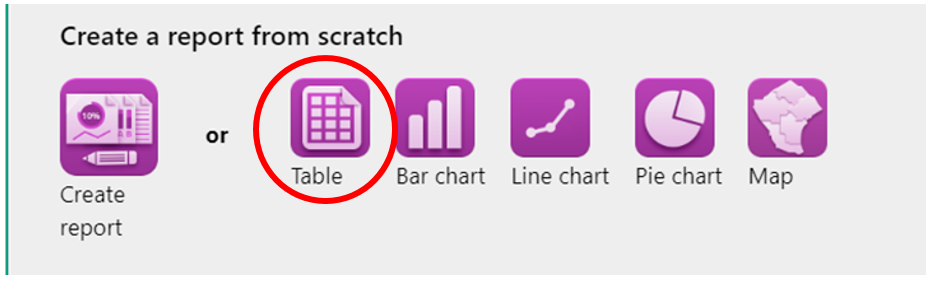
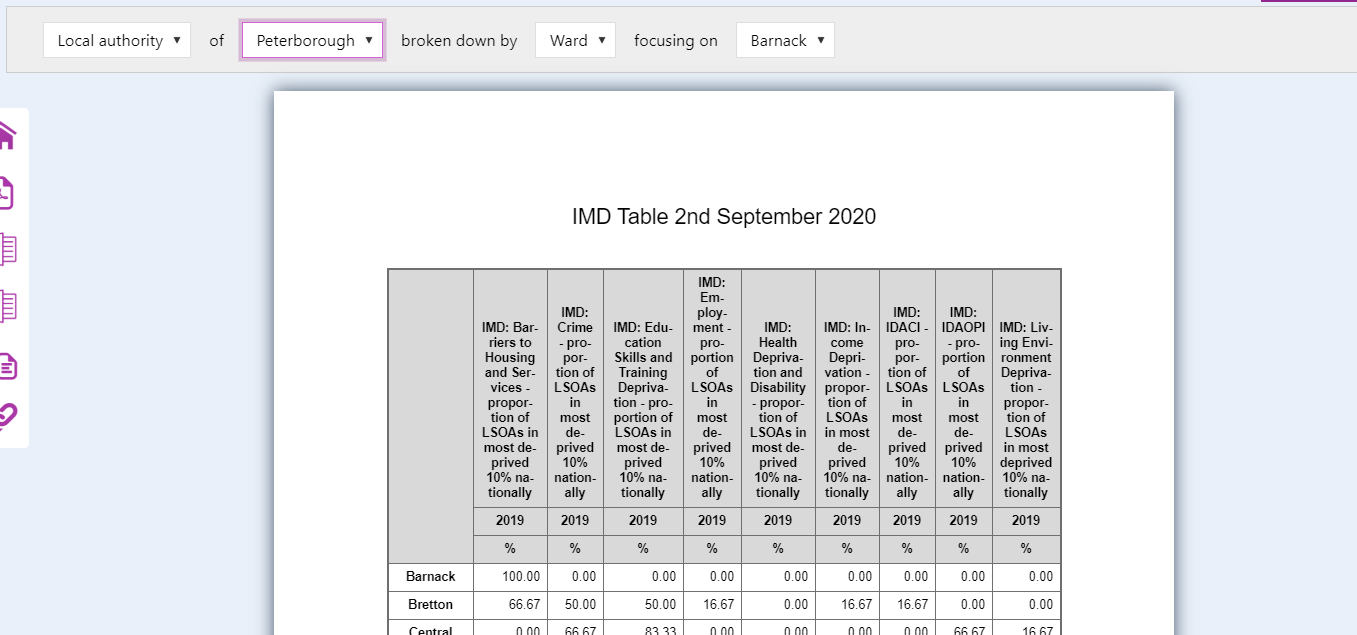
To build a table, you need to click on the ‘create a table’ icon, and then work through the options, choosing those you want, as seen in the image below:
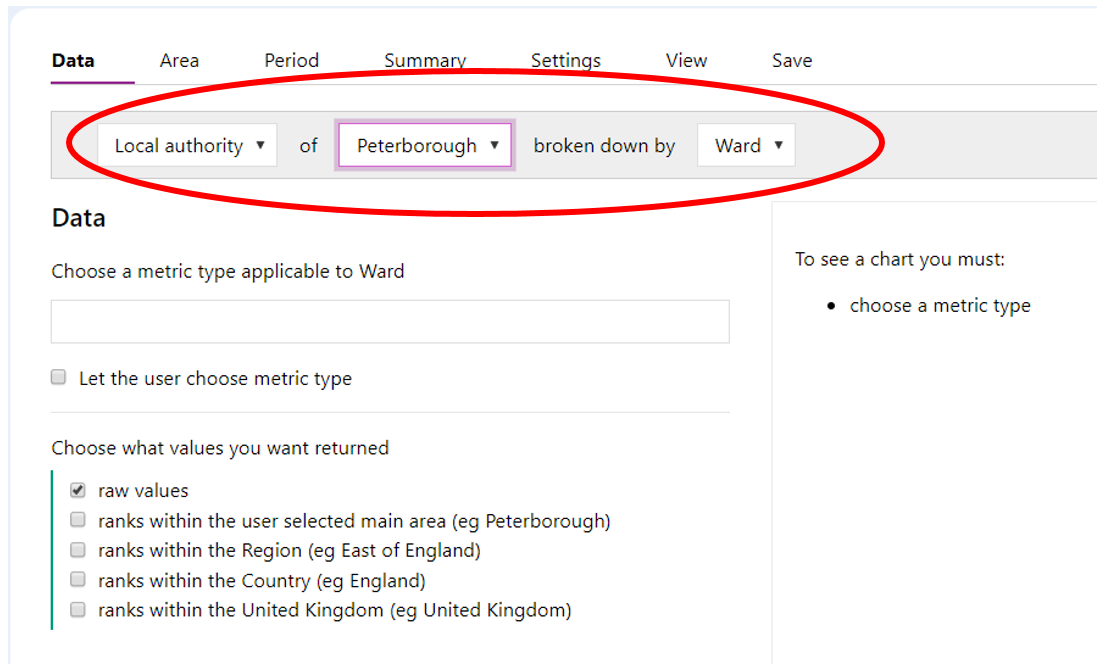
The system will default to your area and breakdown e.g. Ward; but you can change this to any other area or breakdown in the system and view the available data. The third modifier allows you to look for lower level geography data e.g. Ward, LSOA or MSOA.
To begin building a table you need to select a metric. All metrics held in the system can be found on the standards page, in the metrics box - http://standards.esd.org.uk/?
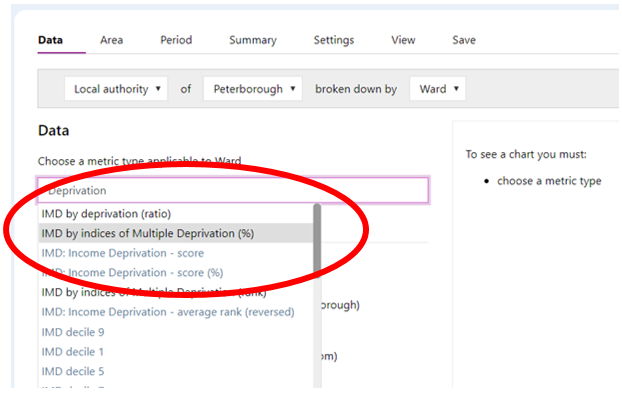
Use the search box below to find the metric you require: e.g. Indices of Multiple Deprivation (%); and click on it.
Metrics appearing in ‘black’ have a ‘Breakdown’ associated with them. ‘Multiple’ metrics and other metric options will show if these are selected. Keep them all or remove those not wanted. Metrics appearing in ‘blue’ are single metrics.
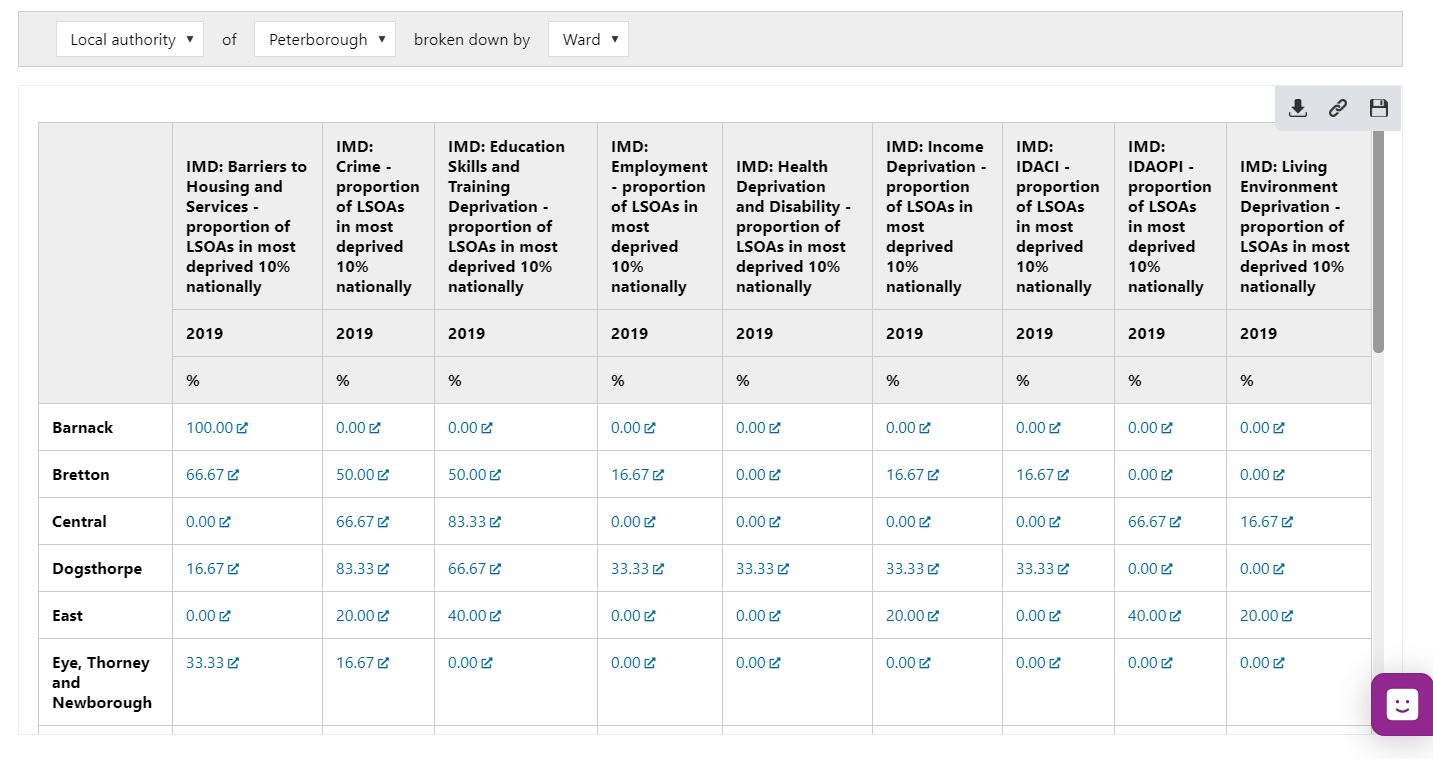
Once selected a table will appear on the right-hand side of the screen. See below:
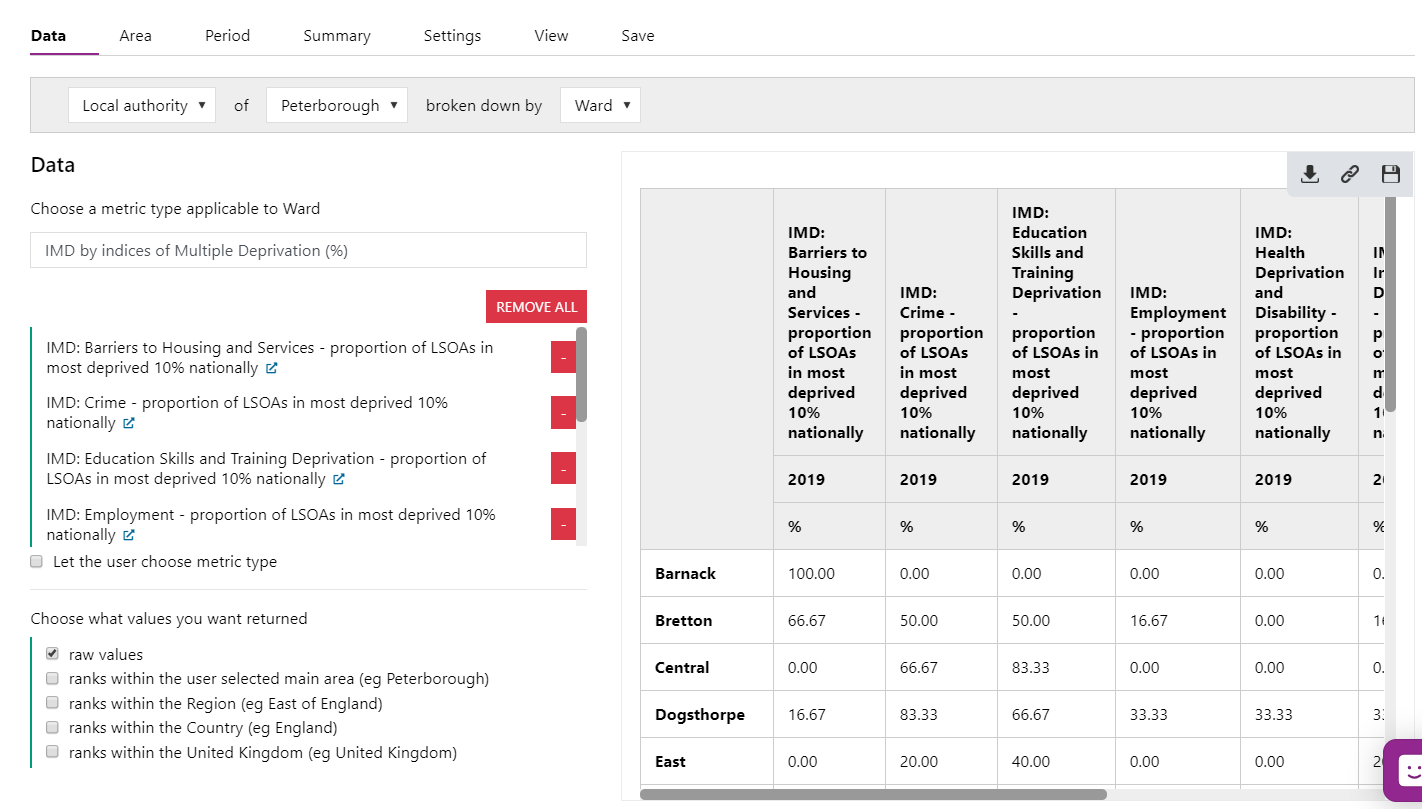
Use ‘Remove all’ to remove the selections. Or remove them individually via the ‘-‘ icon.
At the top of the table you will see this tool bar:
You can now download the data or get a link to the table, which can then be used to embed the information on a website. You can also view this data online but if you want to save this table into a report so you can view it quickly again, click on the ‘save’ icon.
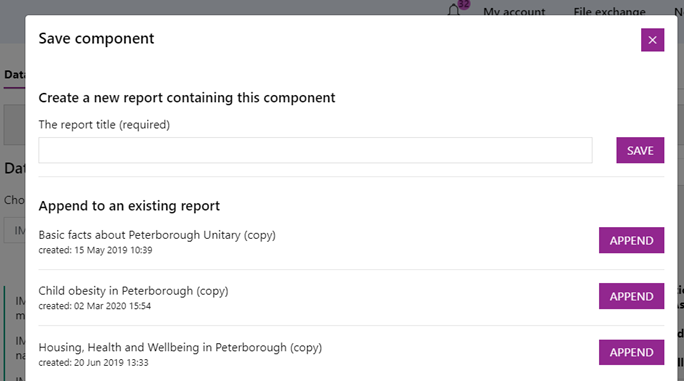
When you save the component, a ‘pop-up’ box will appear to prompt you to save the component with a name so you can find it again next time or append it to an existing report in your library.

If you choose to save it, a new report will be created in ‘your library’ as per below. It is also ‘editable’ by clicking on the ‘pencil icon’.
If you have the information you need, you can stop at this point or there are several options where you can carry on editing the table to be more specific, these include:
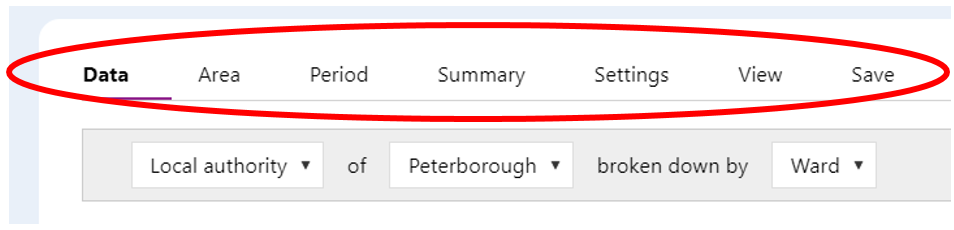
- Data – in this option you can change the values you want to see in the table to include raw values and various rank options.
Select ‘Area’ to progress.
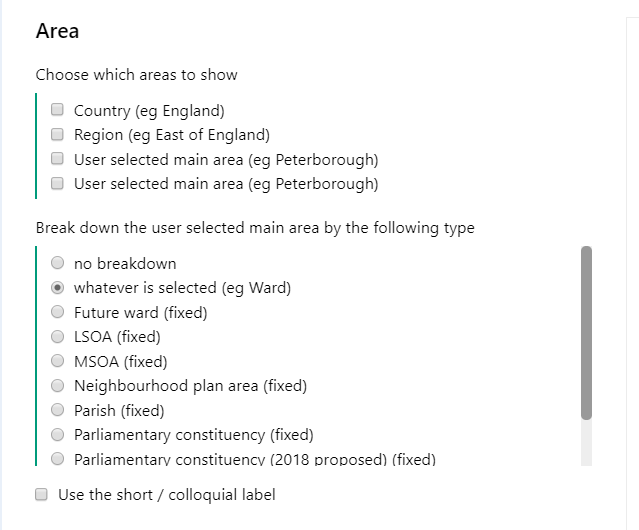
- Area – in this section you can change the area for which data is displayed. For example, instead of Wards, you could change it to districts.
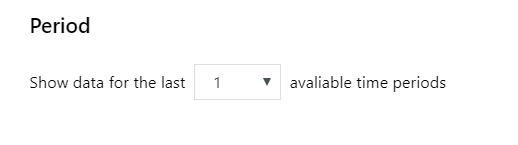
- Period – here you can select the periods required to view your data
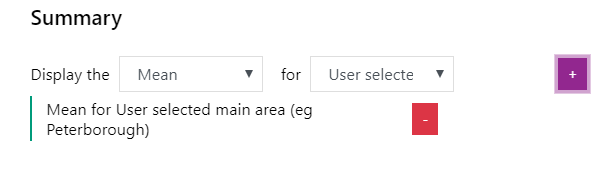
- Summary – in this option you can add summary values such as totals, minimum, maximum, median, medium and percentiles.
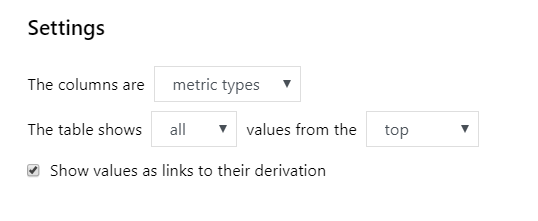
- Settings – this gives you the ability to swap the rows and columns around and you can also display a selected section of the data, such as the top ten or bottom ten values. This can be very useful if you are looking at lower lever of geographies data where there are many areas.
- Check the ‘Show values as links to their derivation’ so users can see where the data comes from when they view the component online.
- View – this section will display your final table as it would be seen when printed.
- Save – there are a number of options. The save tab will save your table as a report in LG Inform Plus. When you save it you will be taken into the report builder screen as seen above.
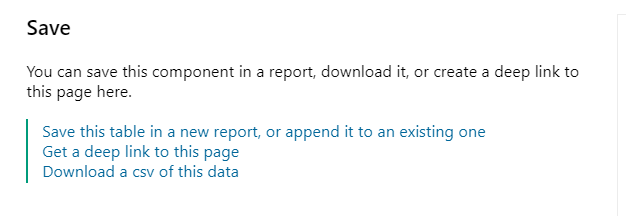
By clicking ‘Save this table in a new report…’ This dialogue box appears (as before)
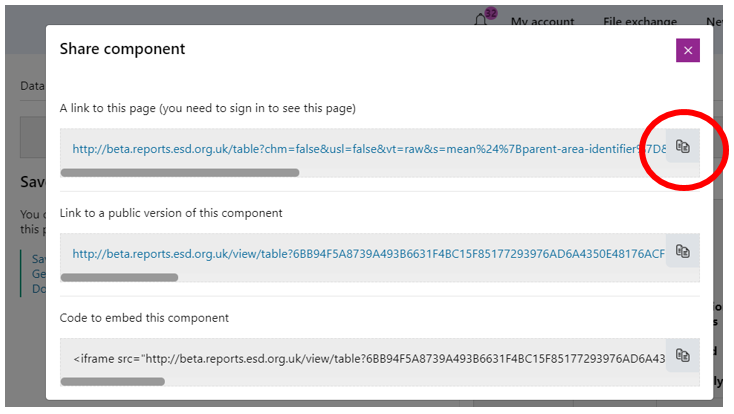
- If you click ‘Get a deep link to this page’ then the following dialogue box appears. Just save the item you require to your clipboard to progress. You can share this link with others so they can see your results.
- To exit any aspect just click the ‘House’ icon at the top left and you’ll be taken back to the Hub page.

- Alternatively, click on anywhere in the left-hand side navigation to move to a different LG Inform Plus module.
Back to top
Viewing Reports
Your new report will show on the left-hand side of the ‘Your data and metrics’ Hub page under ‘Your reports’ as below:
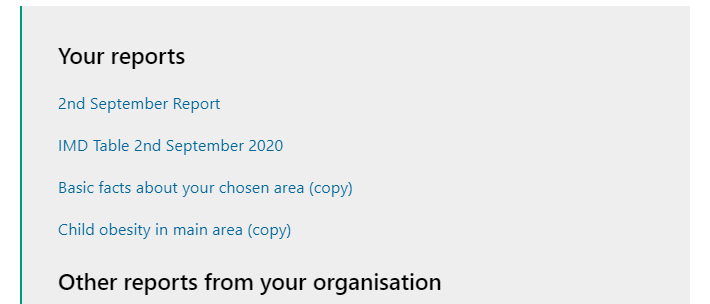
The hyperlinks for each report take you to the latest saved versions.
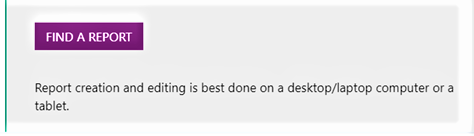
To view all the reports you have created/saved click ‘FIND A REPORT’ in the dialogue box below
This dialogue box opens. From here you can find reports you have created across LG Inform Plus, LG Inform and see any reports from the LGA or reports that have been shared with you.

If you want to ‘edit’ or ‘delete’ a report you can do so at any time. From here you can also search for other data items.
Back to top
Creating other components
The process for creating a bar-chart, line-chart or pie chart flows in the same way as for a table. First select your metric and any summary settings and options that you want, and then either download or save as a report.
The last option in this area is to create a ‘Map’, which has a few additional options.
When you select ‘Map’ and choose your metric; e.g. Population density; the map on the right-hand side will update. You can stop at this point and save it or download it. There are additional options on the highlighted grey task bar on the top right-hand of the map. The first option puts the data into a table and the second option downloads an image of your map that can then be used outside LG Inform Plus.
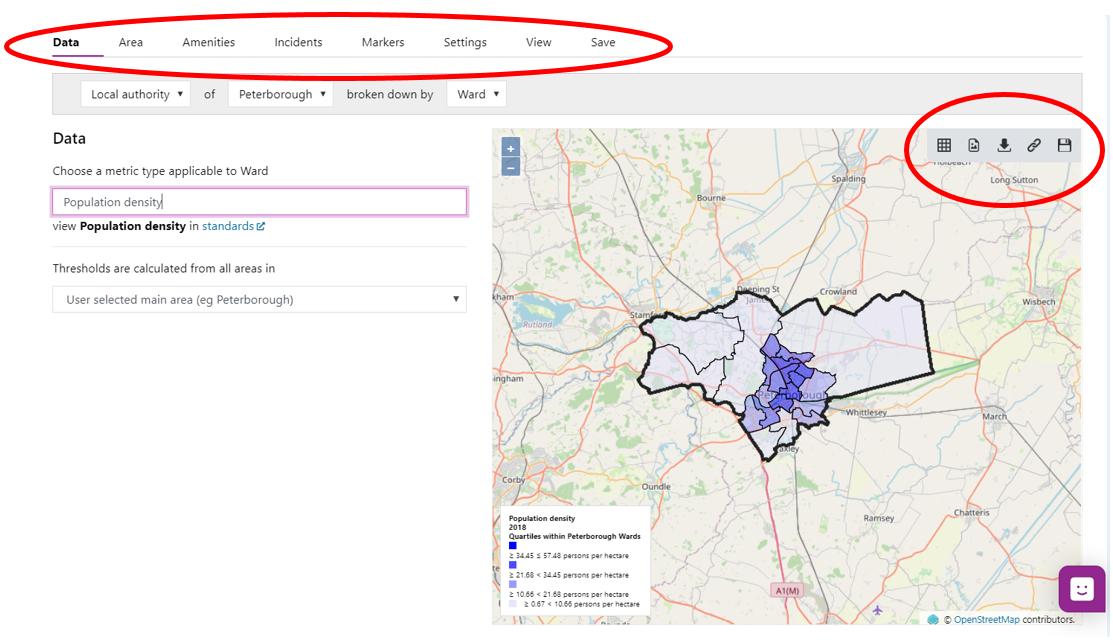
You can continue and edit your map with the options on the top of the dialogue box.
- Area – you can change the breakdown of areas shown on your map, and also overlay the map with additional boundaries, such as parliamentary constituencies. In this tab you can also add labels to your map and outlines.
- Amenities – you can add a pre-loaded set of icons to your map to display local assets like the location of schools, libraries, dental surgeries or post offices. These will be shown on your map as small icons. If there is more than one amenity close by there will be a number next to the icon to show how many are there.
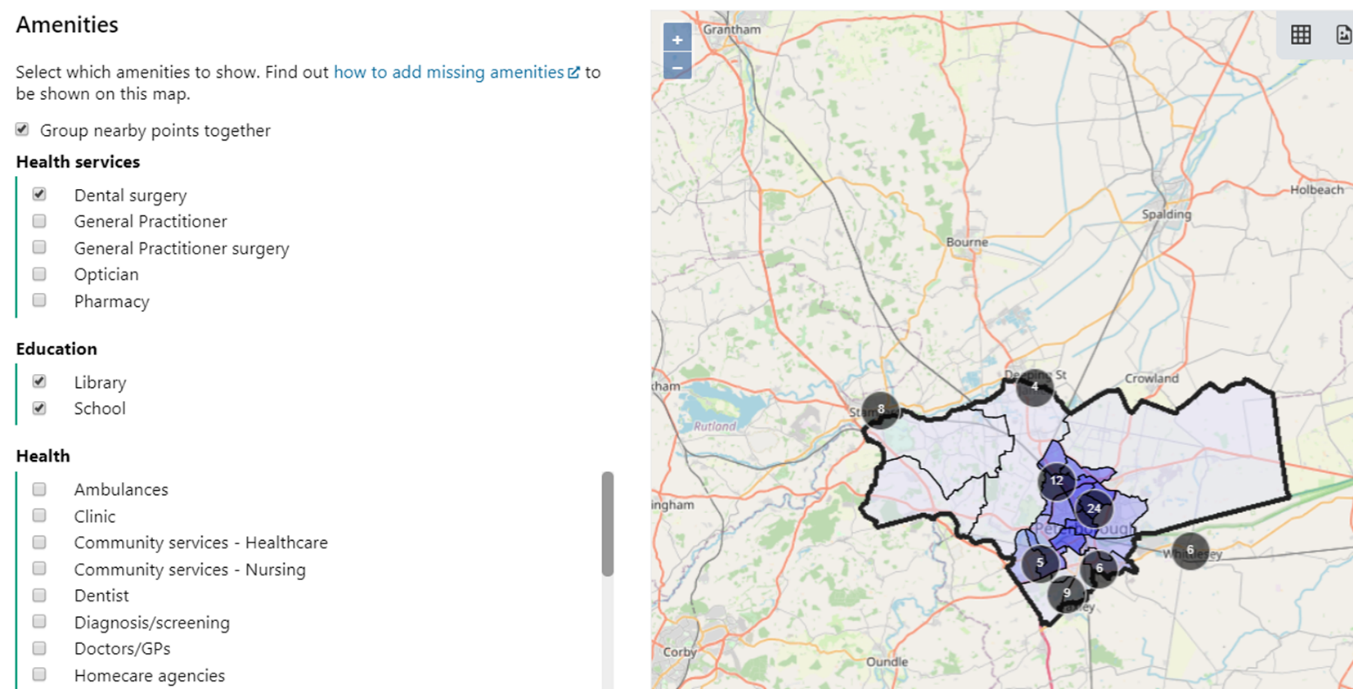
There are several amenities already in LG Inform Plus but if you want to add more, there are instructions on how to do so here.
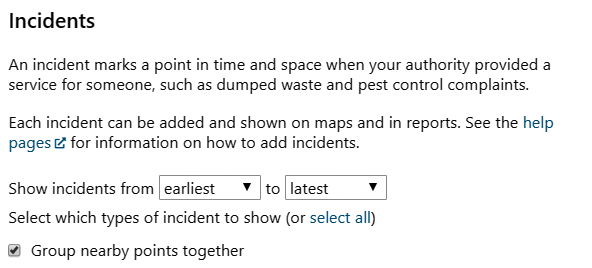
- Incidents - an incident marks a point in time and space when your authority provided a service for someone, such as collecting dumped waste and recording pest control complaints. There is a help page which explains how to add Incidents.
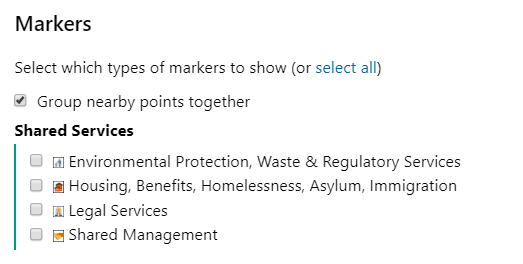
- Markers – are shared services that the LGA Research team have added to the system that can be selected from a prepopulated list to display in your report.
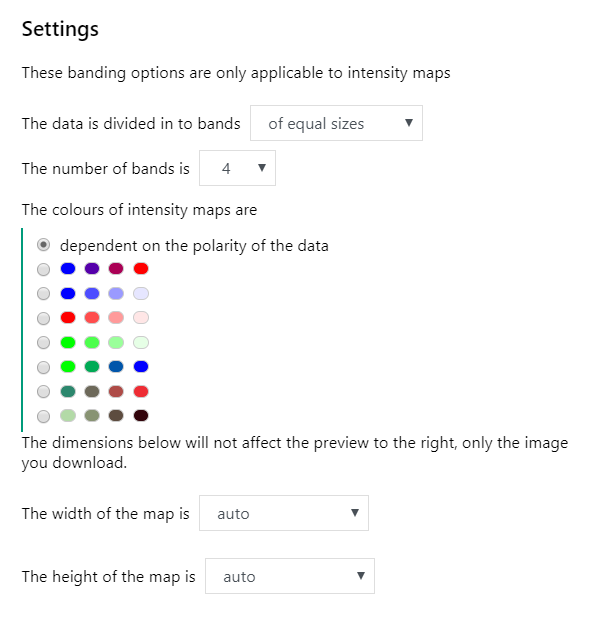
- Settings - is the section to change the way your report looks. You can change the colours on the map, size of the map and the number of bands your data is displayed in.
- View - where you can see what your final map will look like
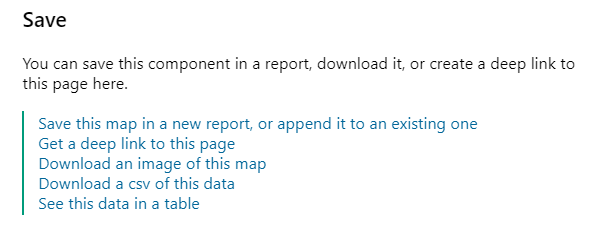
- Save - save it as a report so you can view and edit it at any time. You can also convert the map to a table.
Back to top
Create a report
Go to the ‘Your data and metrics hub page’ and click the ‘Create report’ icon:
When you click on ‘create a report’, the ‘Report details’ dialogue box will open.
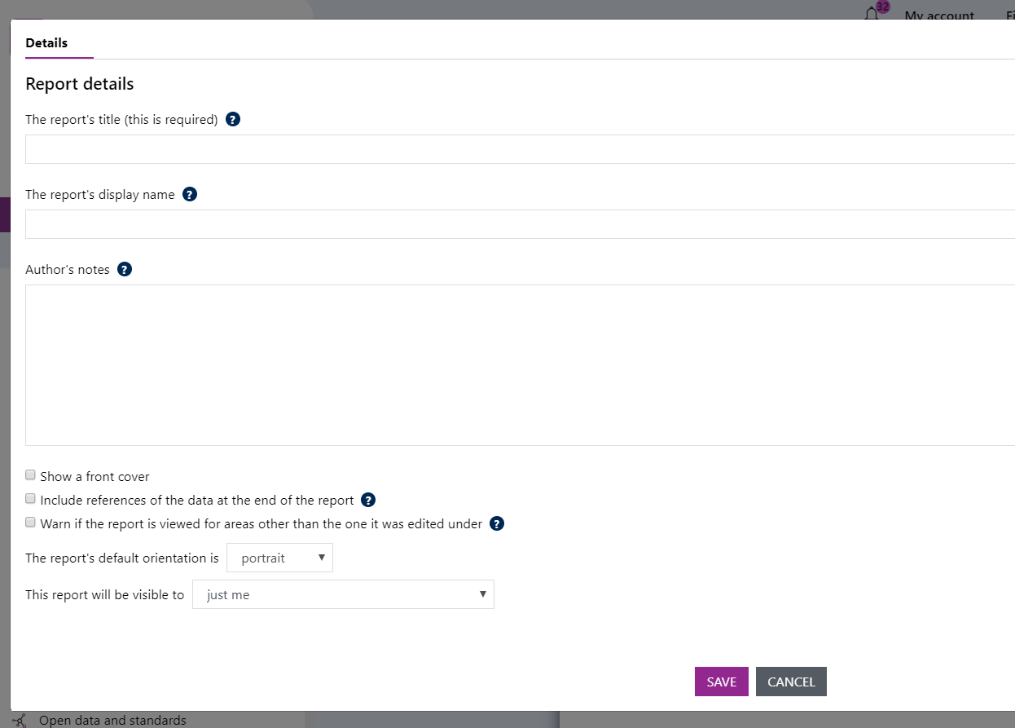
Here you you will be asked to give the report a title, display name and add some notes. The ‘?’ symbols provide helpful information for each field.
Other options include:
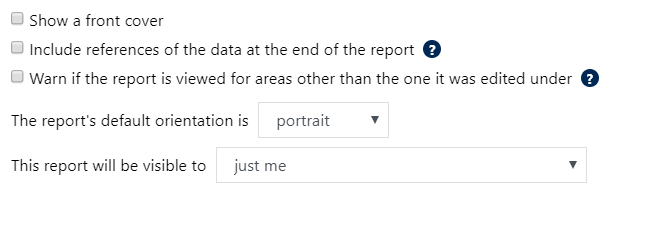
At this time you can
- add notes, which will be displayed in your search when you have finished the report.
- Include references for the data in your report, and this will give you a table at the end of your report with links to all the metrics that you have used.
- A warning option. This alerts user who may have selected selections which aren’t available for your data items.
- Make the report layout portrait or landscape.
- Choose who can see your report.
You can change these options at any point.
Once you have added a title and clicked ‘Save’ a report ‘canvas’ will open as shown in the image below.
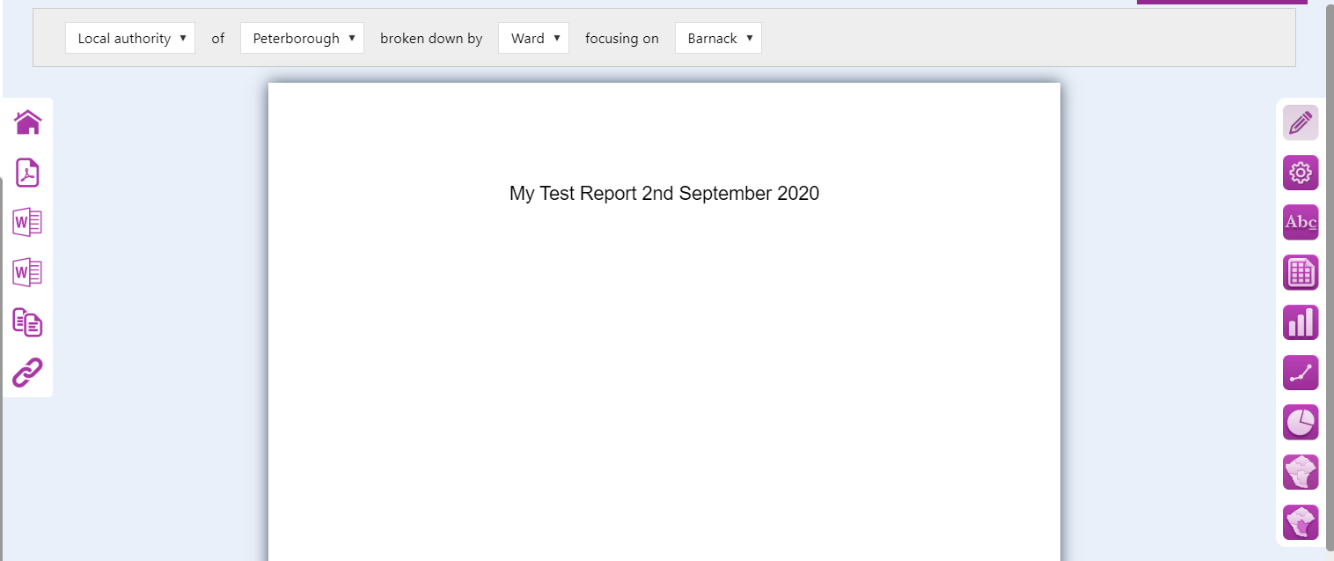
The options on the right allow you to add components e.g: a text box; chart or map; and can also be used later to further edit your report. On the left-hand side, there are options to save, print or create a link to the report. There is also the option to make an editable copy of your new report, so if you like the format you can copy the report and simply change the metrics and information.
To build your report use the icons on the left-hand side.
Working down the options on the right-hand side:
![]() With this icon you can change the report settings, such as the title.
With this icon you can change the report settings, such as the title.
![]() This will add a text box to your report, in which you can add text, images and links. There is also a text token editor, through which you can create dynamic text that updates as you make changes to your report or as the data is updated by the system.
This will add a text box to your report, in which you can add text, images and links. There is also a text token editor, through which you can create dynamic text that updates as you make changes to your report or as the data is updated by the system.
![]() This will add a table component, with all the options discussed earlier in this help guide.
This will add a table component, with all the options discussed earlier in this help guide.
![]() This will add a bar-chart you can customise.
This will add a bar-chart you can customise.
![]() This will add a line-chart which you can customise
This will add a line-chart which you can customise
![]() This will add a pie-chart, again which you can customise.
This will add a pie-chart, again which you can customise.
![]() The first map icon gives you a ‘heat-map’ you can customise to show data as discussed earlier in this help guide.
The first map icon gives you a ‘heat-map’ you can customise to show data as discussed earlier in this help guide.
![]() The second map icon adds a map in which your selected area is highlighted. It can display the whole local authority, or parts of it if required. You can add amenities, incidents and markers to this map, but not metric data. To view metric data for a map you need to use the first ‘heat map’ map icon.
The second map icon adds a map in which your selected area is highlighted. It can display the whole local authority, or parts of it if required. You can add amenities, incidents and markers to this map, but not metric data. To view metric data for a map you need to use the first ‘heat map’ map icon.
When you select an icon, a line is draw showing where the component is to be positioned. Just follow the wizard associated with each component to add it in.
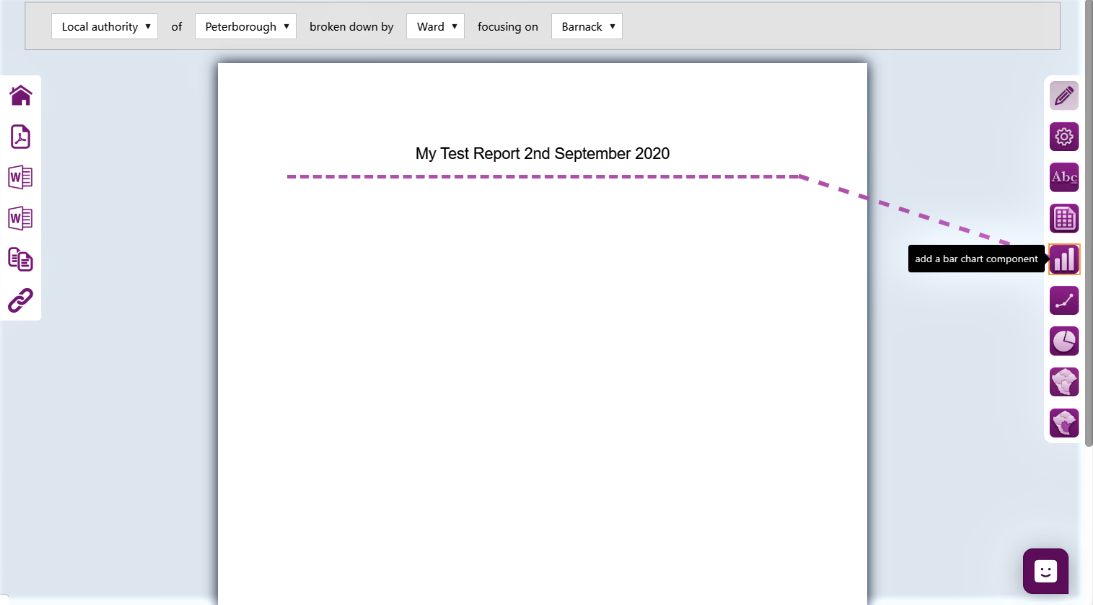
Your report will be automatically saved for you as you progress.
As before, you will find all your reports in your library on the ‘Your data and metrics’ Hub page. In the dialogue box below click ‘FIND A REPORT’.
The icons on the left-hand side of the report can be used to export and share your report.
Go to the ‘Data and reports’ page
Export to PDF
Export to RTF
Export to Word
Make a copy of the report
Send a link to your report
For ease of retrieval your new report will appear at the top of your listing on the ‘Your reports’ hub page. See below:
Back to top
Need more help?
We hope you found the introduction to the ‘Report writer’ useful, but if you have any further questions or would like to learn more, fear not! Help is at hand.
Use the Help link in the navigation bar anywhere in LG Inform Plus to read through our online help guides, or send an email to support@lginform.local.gov.uk and the support team will get back to you (Monday – Friday, 9 a.m. to 5.30 p.m.).
Back to top